It’s that time of the year. The air is getting cooler, days are getting shorter, and the hustle and bustle of the holiday season is right around the corner. It’s also that time of the year when organizations reflect on all they accomplished during the year.
Annual reports have long been a way for organizations to highlight the impact of their work and showcase the activities they had throughout the year. More organizations are opting for web-based or digital reports and for good reasons:
- They’re dynamic – With digital reports, content is designed to be more interactive, visually interesting and more user friendly, and will keep people engaged from beginning to end.
- They’re measurable – Reviewing your site’s traffic data can reveal things like what content your audiences are most interested in, how they found it, geographic locations, and many other useful details.
- They’re sustainable – Opting for a digital report reduces your environmental footprint. Since it’s built on the web, it’s a simple click away to edit content in case that an update is needed.
- They’re easy to share – Reach a wider audience and target specific groups via social media, email newsletters, and links from your website.
- They’re responsive – With increased mobile usage, reports that are optimized for mobile, desktop and everything in between increases audience engagement.
Ready to be inspired? Check out these examples of annual reports that make a case to go digital:
![]()
WeTransfer
Packaged as an “Ideas Report”, WeTransfer chose to create a compelling, design-first landing page to tease their full report. Tucked within each big idea are smaller bites of key findings and other information. Pair that feeling of exploration with a clean design aesthetic and you get a refreshing take on the traditional annual report format.
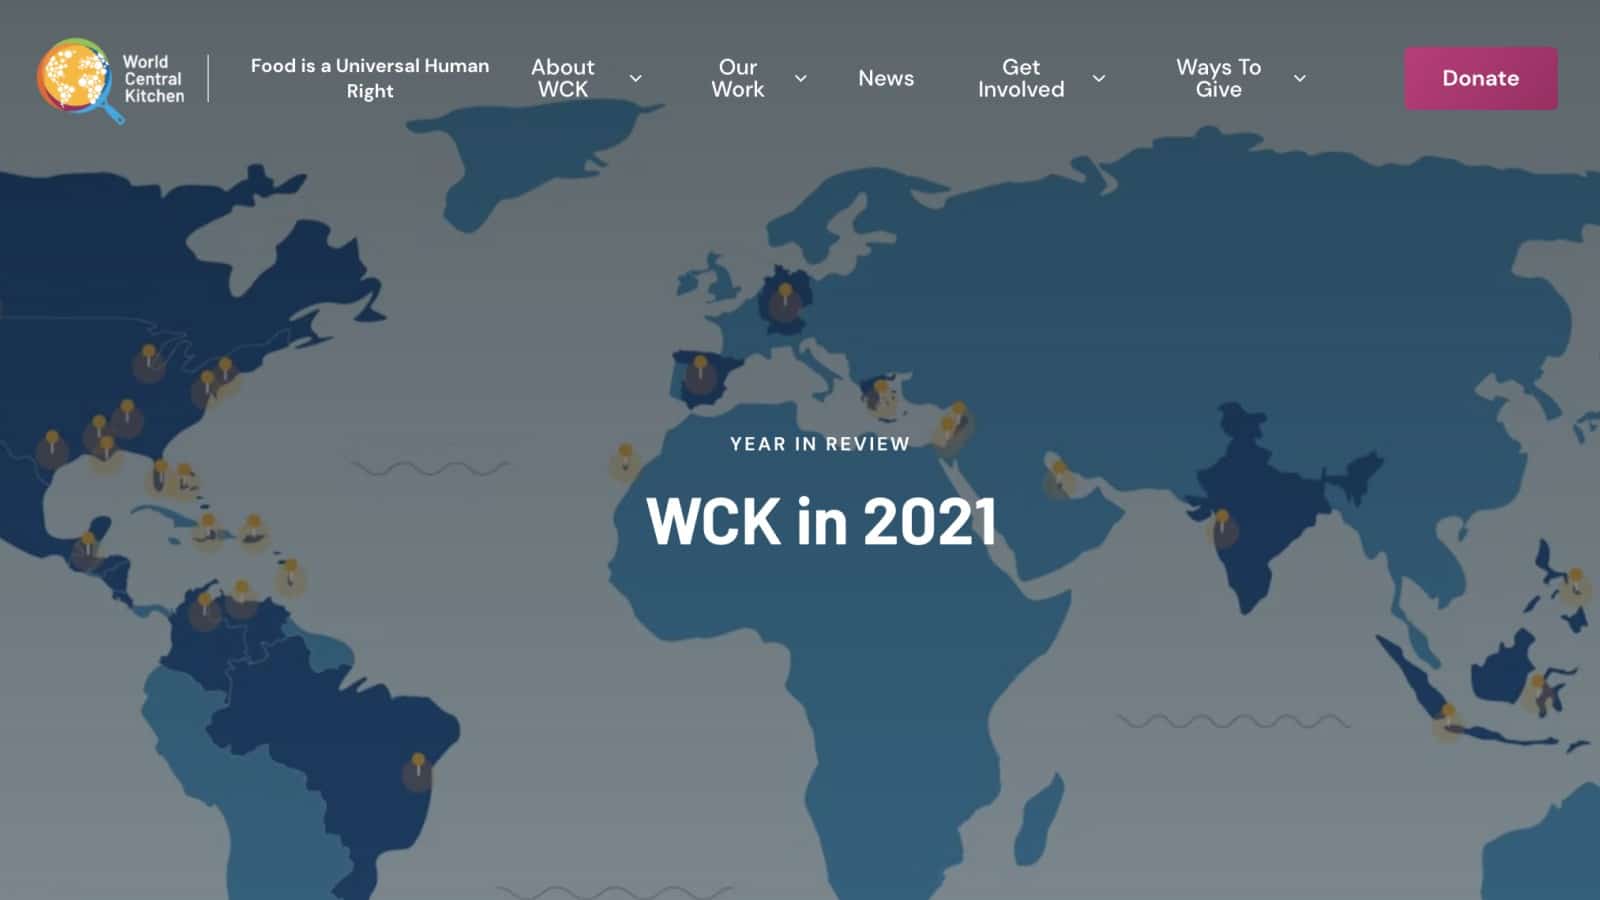
World Central Kitchen
For many humanitarian-minded organizations, the past two years have been transformative. World Central Kitchen, which provides meals and helps establish stable food environments for communities in crisis, is no different. Their 2021 annual report is a sobering and emotional reflection of their impact in 2021. Presented as a linear month-by-month review, they emphasize the content and stories of impact.
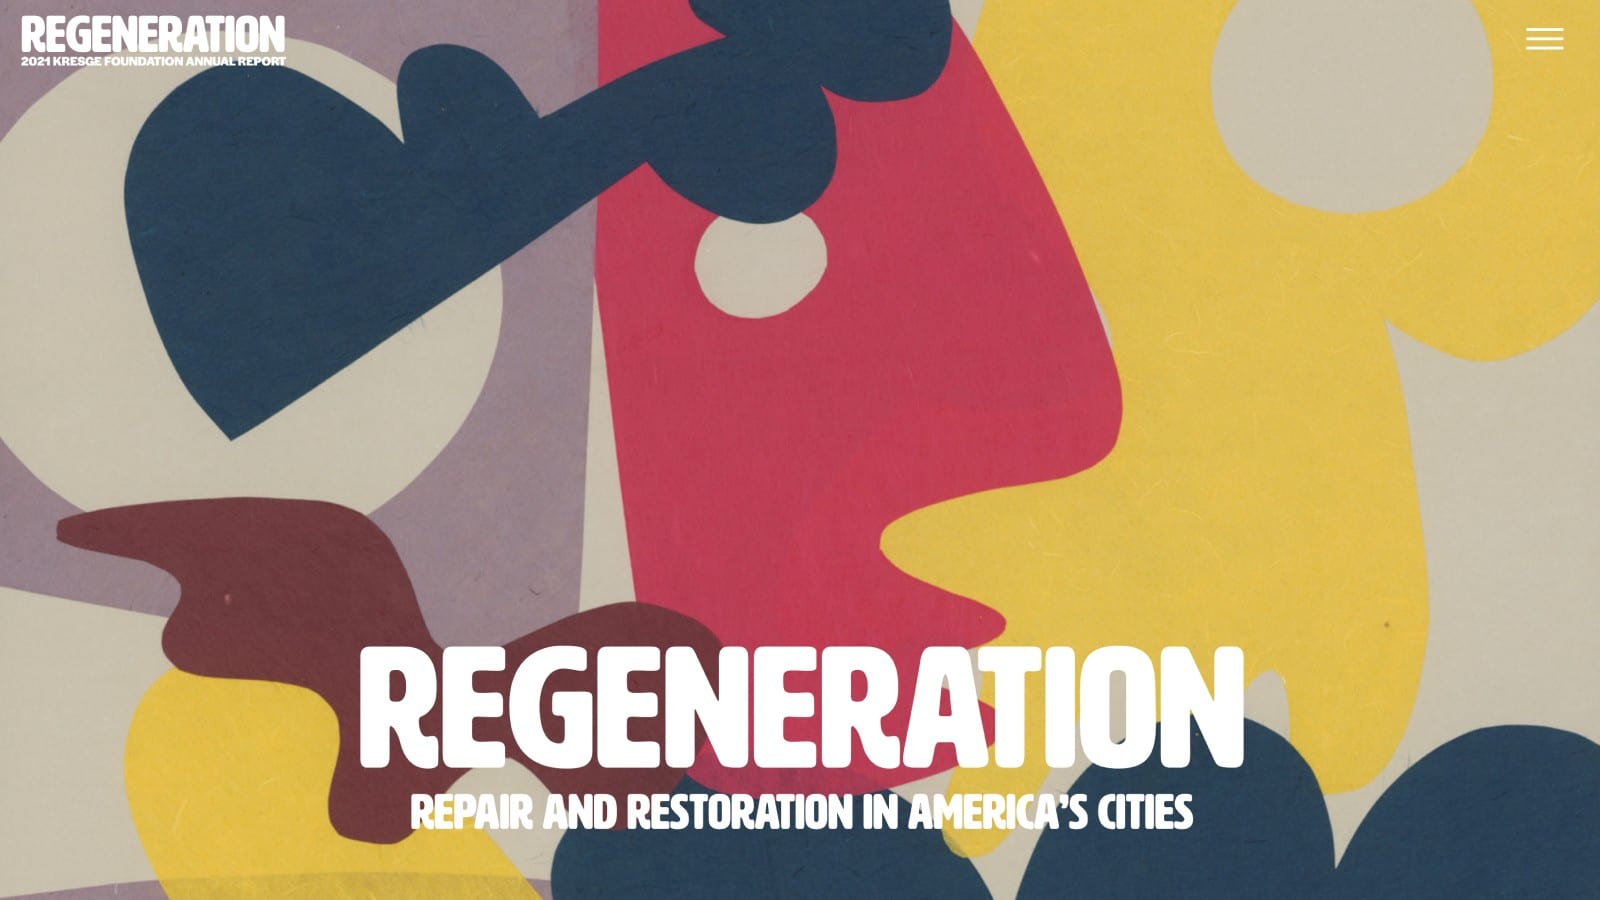
Kresge Foundation
We’re privileged to once again partner with the Kresge Foundation on their latest annual report. Complemented by hand-drawn illustrations, colorful layouts, and playful animations, the report creates a powerful sense of purpose. Our approach is to examine the Foundation’s work in repairing and restoring American cities through awarding grants and social investments to those most affected by inequities and injustices.
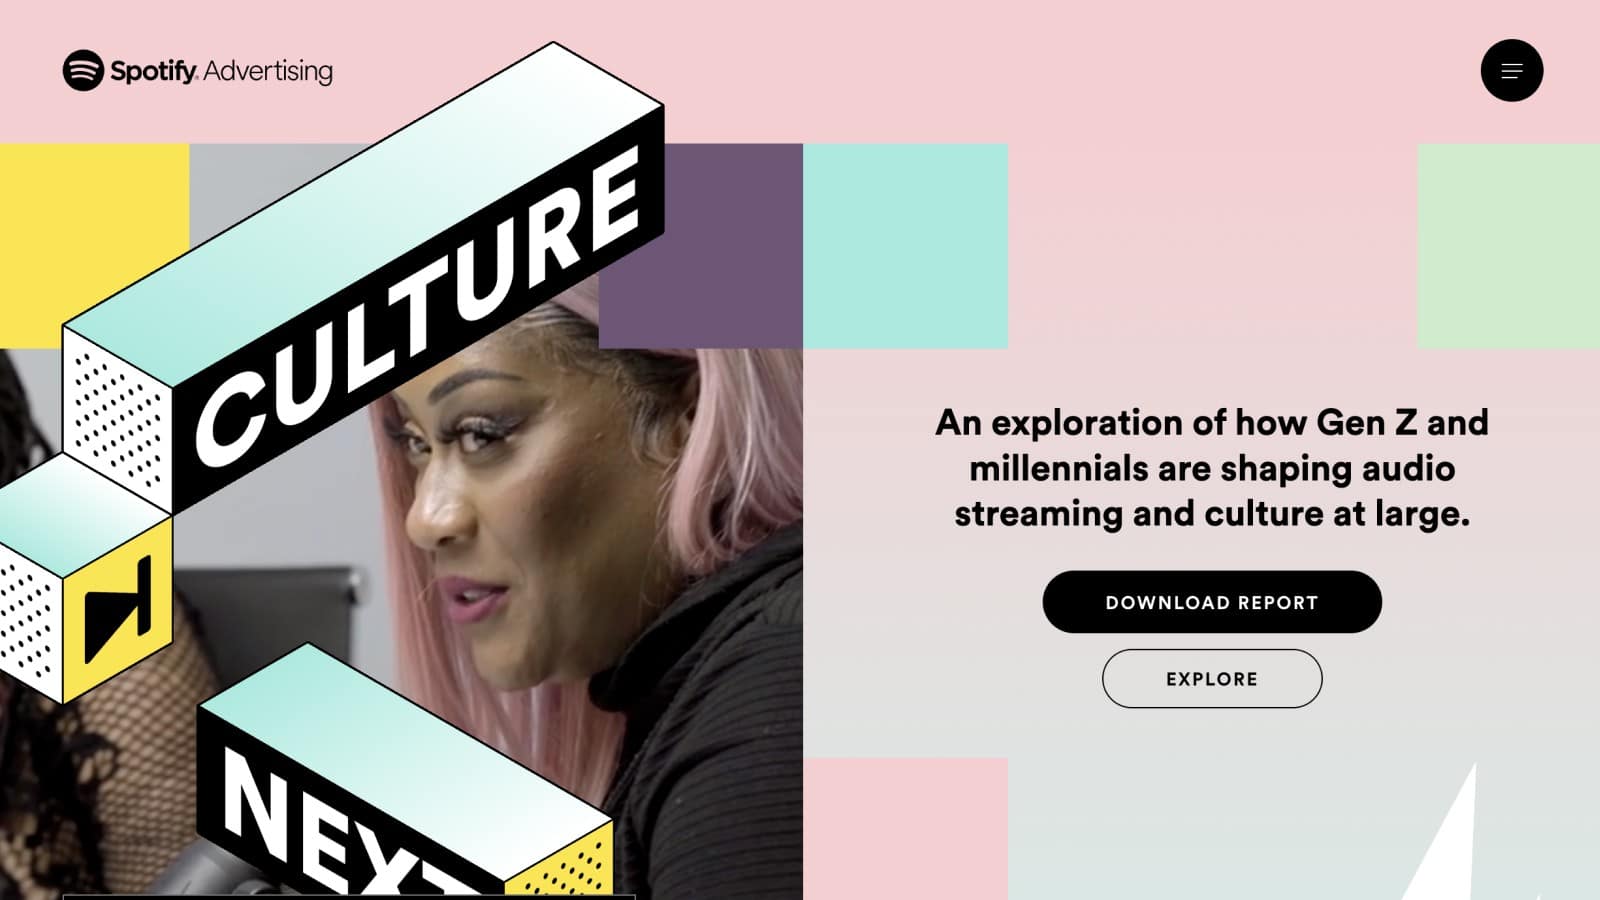
Spotify Culture Report
Leading music streamer Spotify produces many reports. Less annual report and more survey report, this one is unique in its focus on a crucial demographic and how they are influencing their business: Gen Z and Culture. The site is surprisingly simple in structure, but funky, neon/pastel colors and isometric animated illustrations give the whole thing an added layer of creative depth. Fresh uses of animation and audio help create a memorable experience.
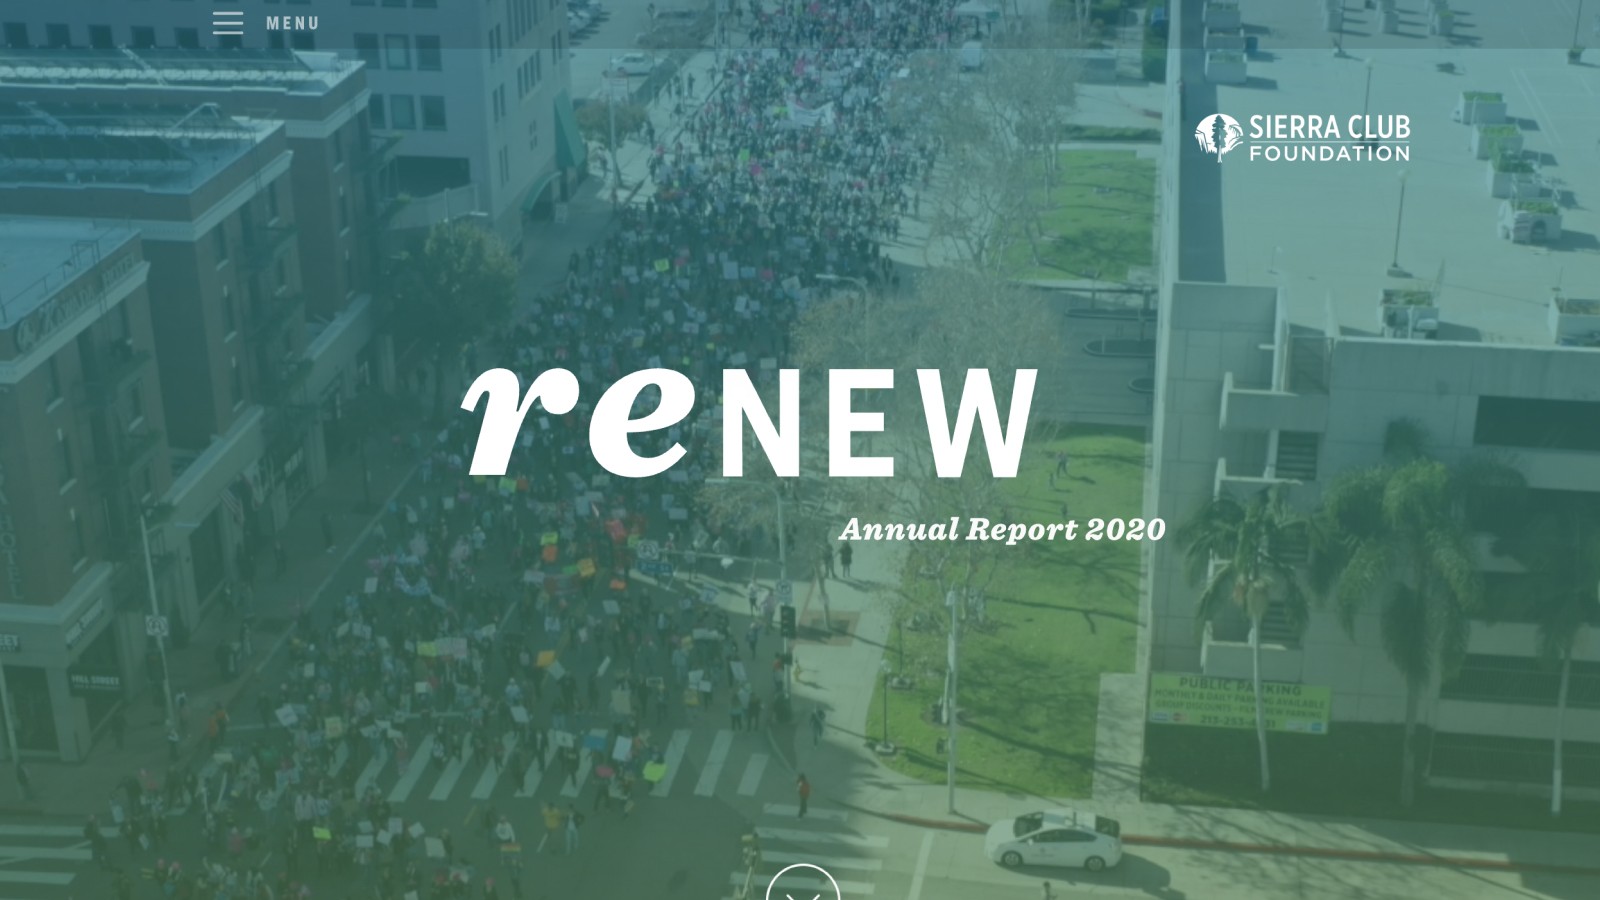
Sierra Club
Sometimes the most straightforward approaches can be the most effective. The Sierra Club’s annual report tells a concise story through a minimal, easy-to-consume one-page website. Set against a dark backdrop, the engaging imagery of natural landscapes presented in a succinct “re-” thematic approach gives the report an elevated presence and professionalism.
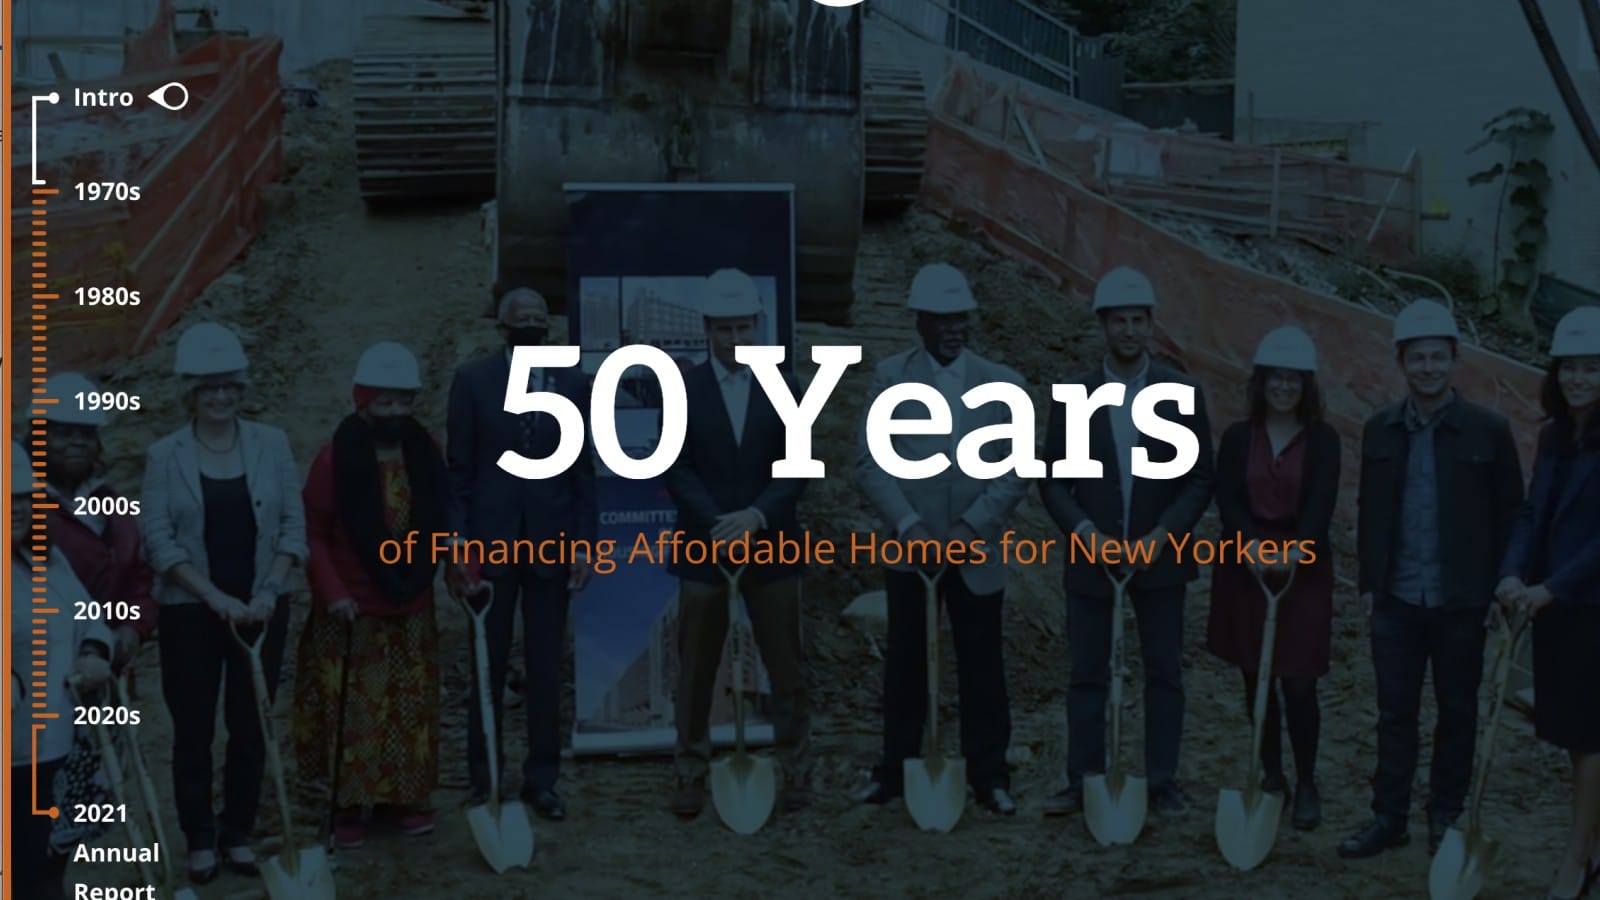
New York City Housing Development Corporation
Neatly sectioned into decade chapters, NYC HDC’s annual report uses subtle parallax effects on photos and thoughtful visual hierarchy to call out important pieces of information. The fixed navigation at the side of the browser acts as anchor links that make it easy to jump to different sections of the report.
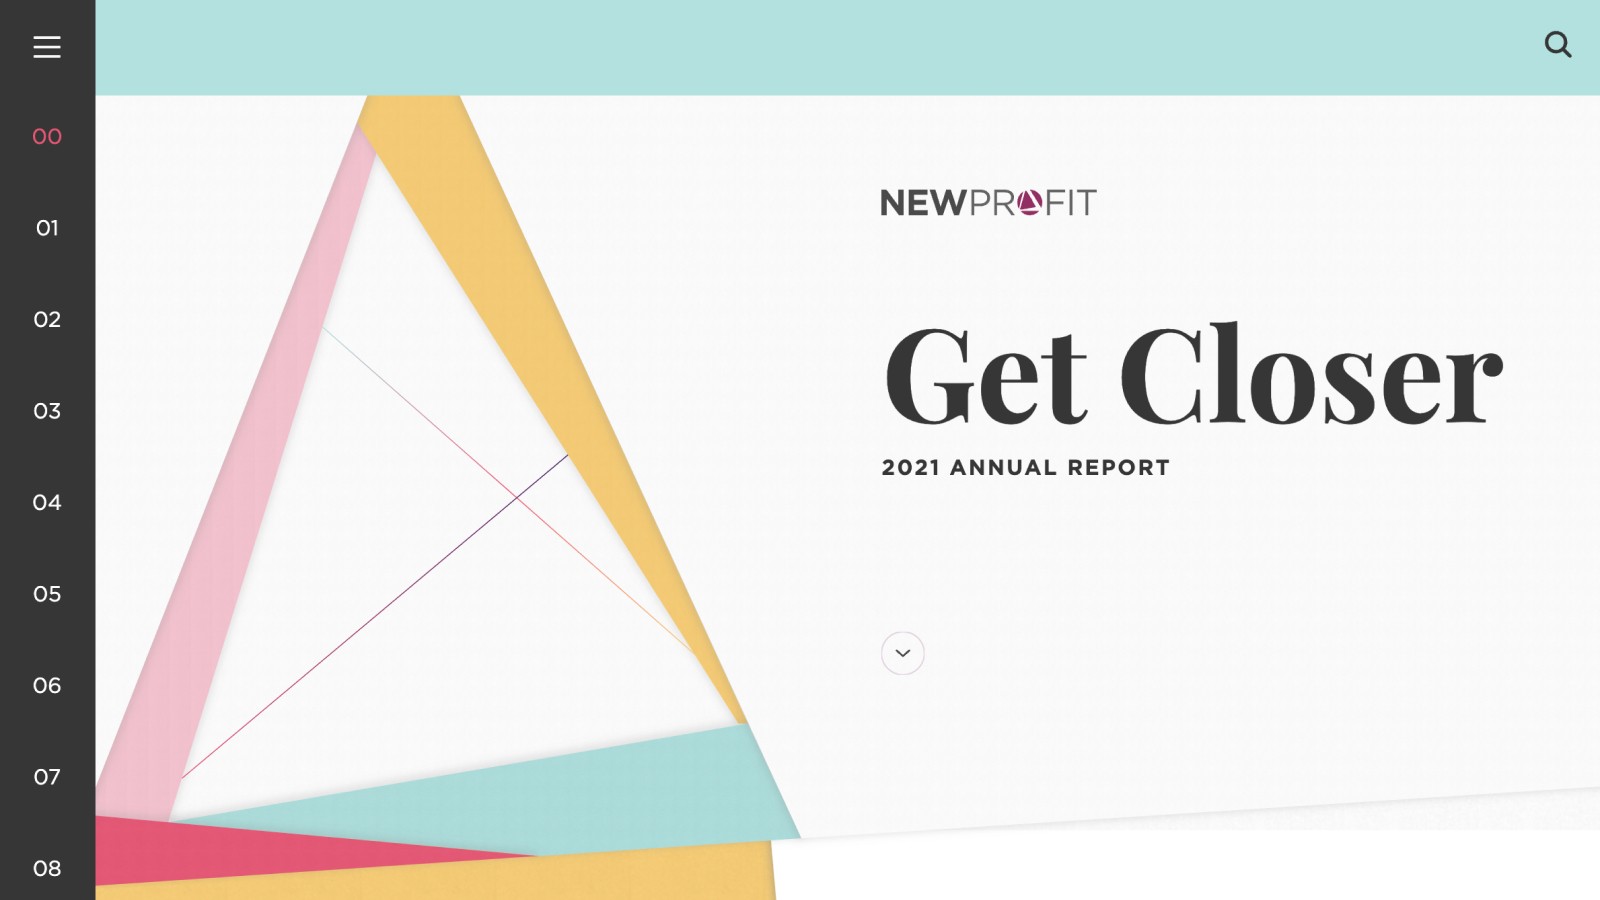
New Profit
New Profit’s 2021 Annual Report condenses their impact into bite-sized highlights complemented and anchored by a robust visual identity system. What would otherwise be a text-heavy report was brought to life with the use of color, data visualization, and illustrations that made scrolling down the report more engaging.
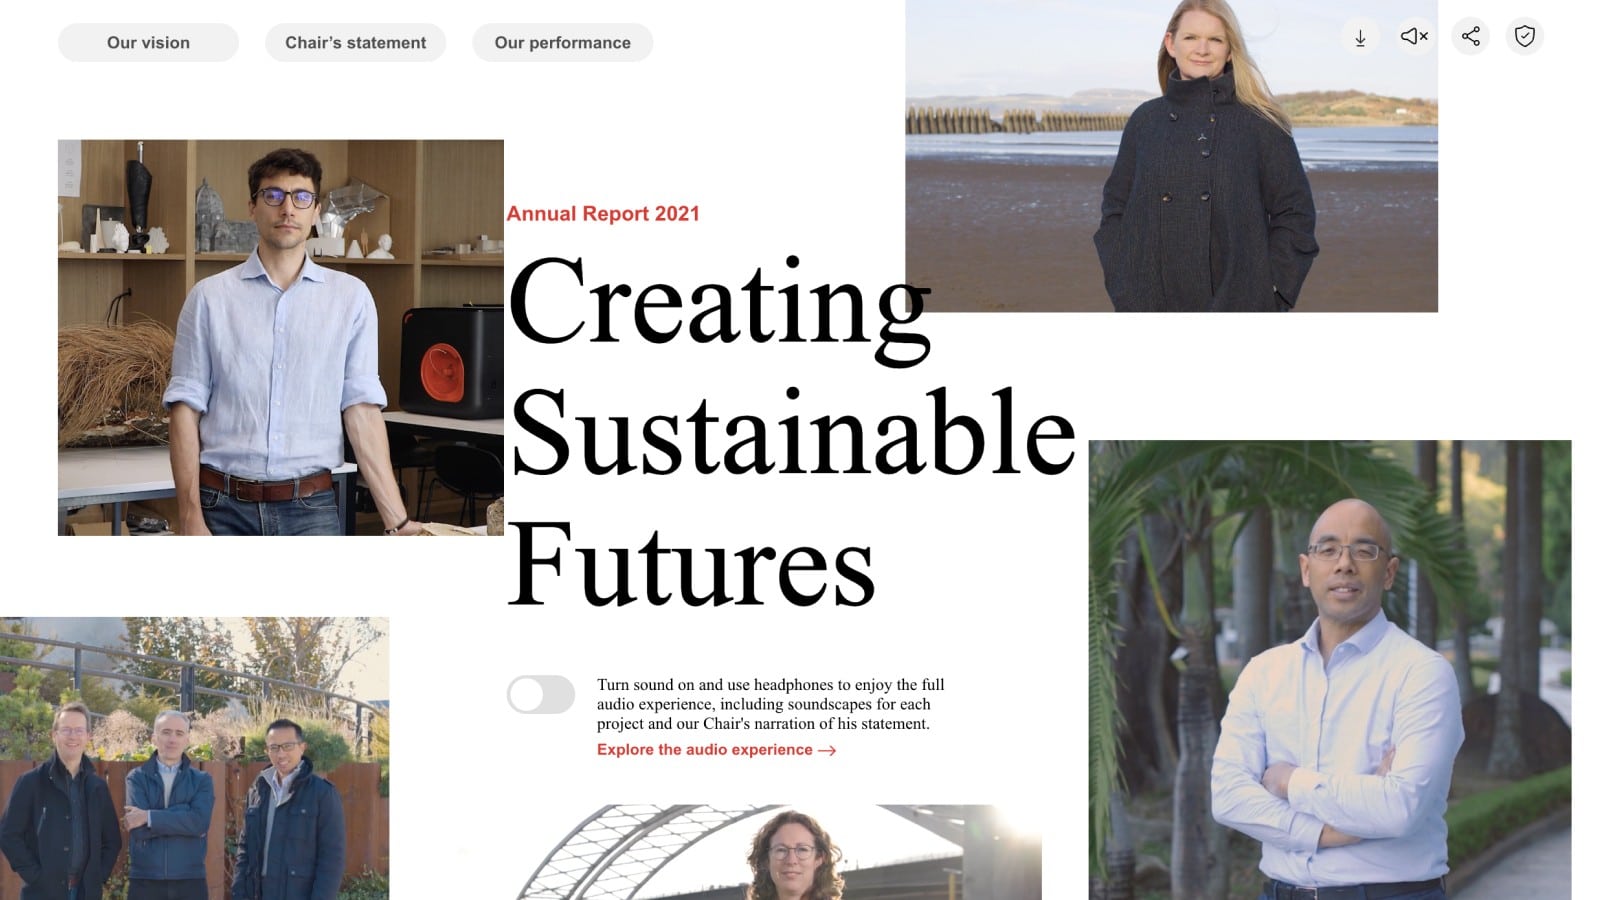
ARUP
We love the approach ARUP took for its latest annual report. The landing page presents five videos that give you the choice of where to begin the journey. The transition from the landing page to each of the globally regional stories is a smooth and compelling experience. Video and picturesque illustrations punctuate a horizontal scrolling experience to tell linear stories of innovation.
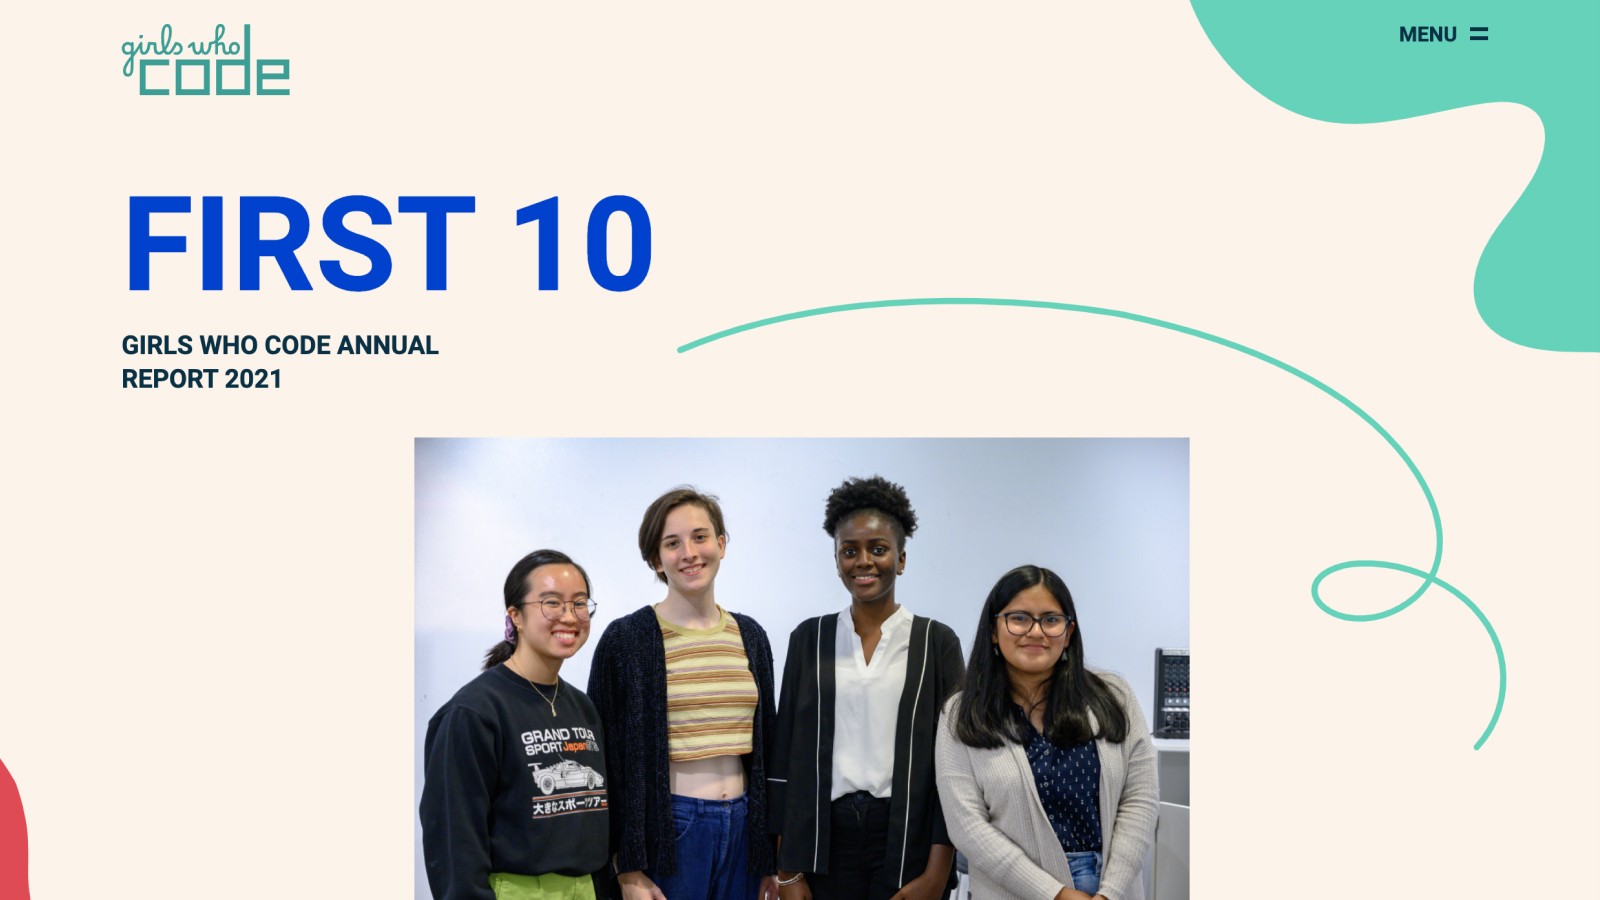
Girls Who Code
For the second year in a row, we are featuring the annual report for Girls Who Code. Once again, they did an exceptional job of visualizing the work they’ve done through the combination of infographics, animation, photography, layout, and color, keeping viewers engaged from beginning to end.
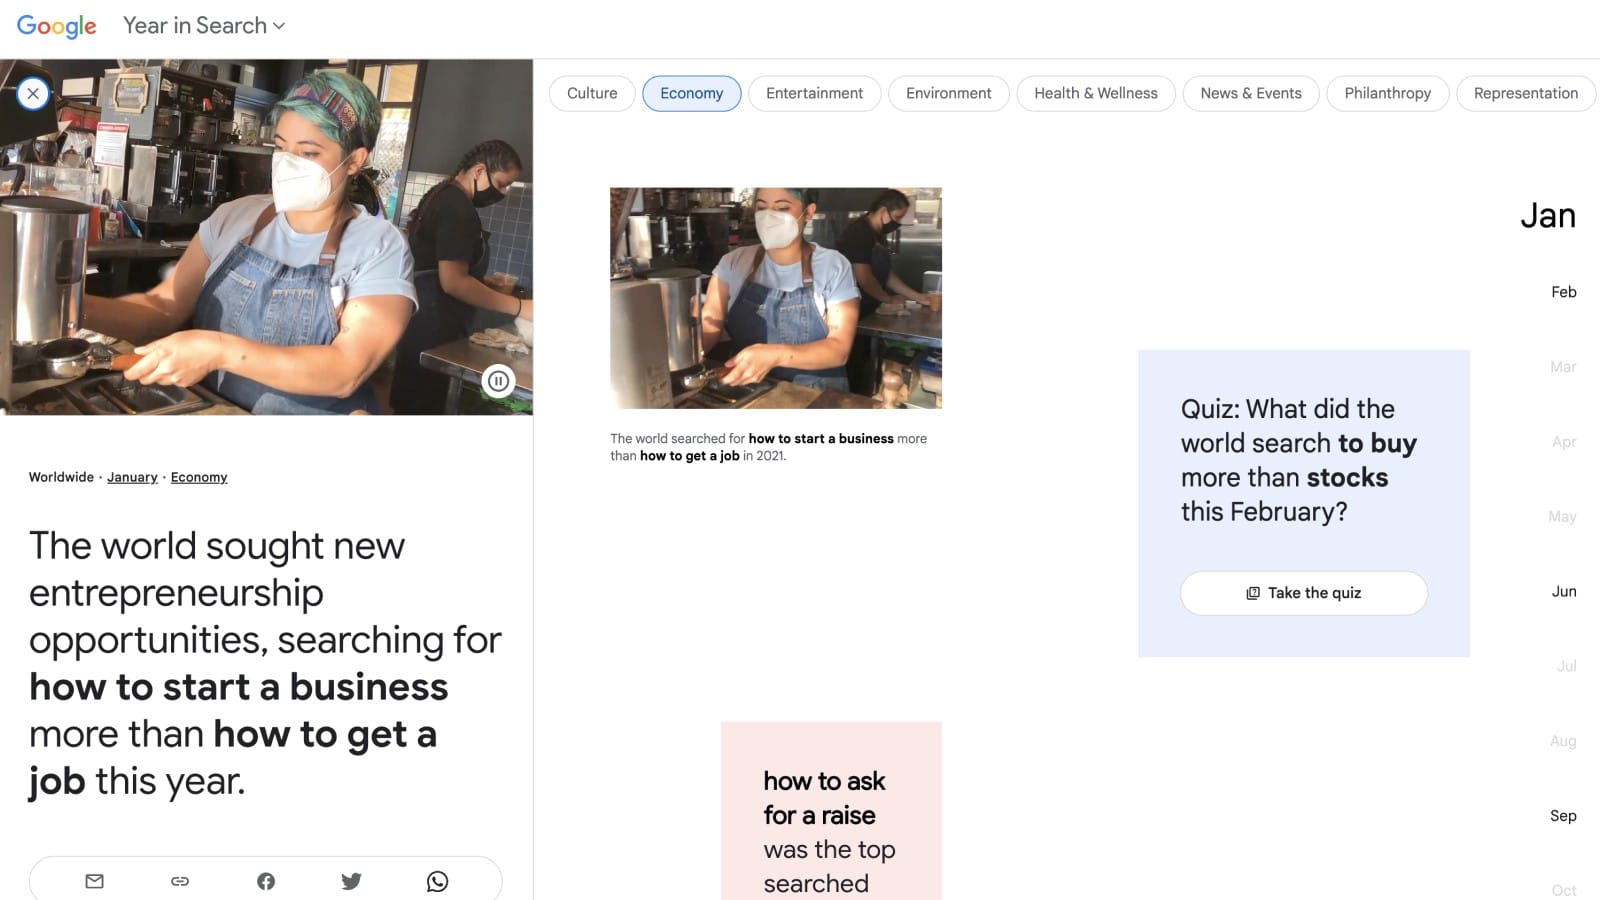
Google Year in Search
The great thing about Google’s Year in Search is its ability to act as a cultural touchstone for the previous year. Presenting each topic’s popularity by month in the areas of the economy, sports, and environment creates an incredibly deep and immersive experience. The design is minimally on-brand and acts as an excellent vehicle to present a large amount of content.
In Summary
Inspire and showcase the impact your organization has made in the past year by creating a digital annual report. Through the use of interactive elements, responsive views, and analytics only available to digital sites, your past year’s efforts will surely not go unnoticed.
Ready to take your annual report to the next level? Contact us to learn more or get started.