A good web-based annual report does something few other communications can: they connect mission, impact, and accountability in one coherent story.
They show not just what an organization did, but why it mattered, who it reached, and how resources were used to get there.
When that story is designed for the web, it becomes more than a recap. It becomes one of the most strategic storytelling assets an organization produces all year.
What a Web-First Annual Report Can Do
- Turns impact into narrative: Most organizations have no shortage of data. What they lack is a way to connect that data to real outcomes. Digital reports create space to pair metrics with meaning and help readers understand not just the scale of the work, but its significance.
- Expand reach and visibility: When annual reports are built for the web, they’re far easier to share and circulate. They can be linked to from email newsletters, social posts, grant applications, and partner communications.
- Build trust through transparency: Clarity is credibility. When financials, outcomes, and decision-making are presented openly and in context, they reinforce stewardship and seriousness without requiring the reader to dig.
- Make complexity approachable: Many nonprofits do work that’s inherently complex. Storytelling creates a narrative flow that readers want to engage with.
- Align internal and external audiences: Annual reports are one of the few moments when boards, staff, donors, partners, and the public are all looking at the same story. A clear, well-structured report creates alignment around what mattered most.
- Extend the life of a single year’s work: Unlike PDFs that disappear into archives, web-based annual reports can live on: linked from grant proposals, shared with partners, referenced in board meetings, and repurposed across channels throughout the year.
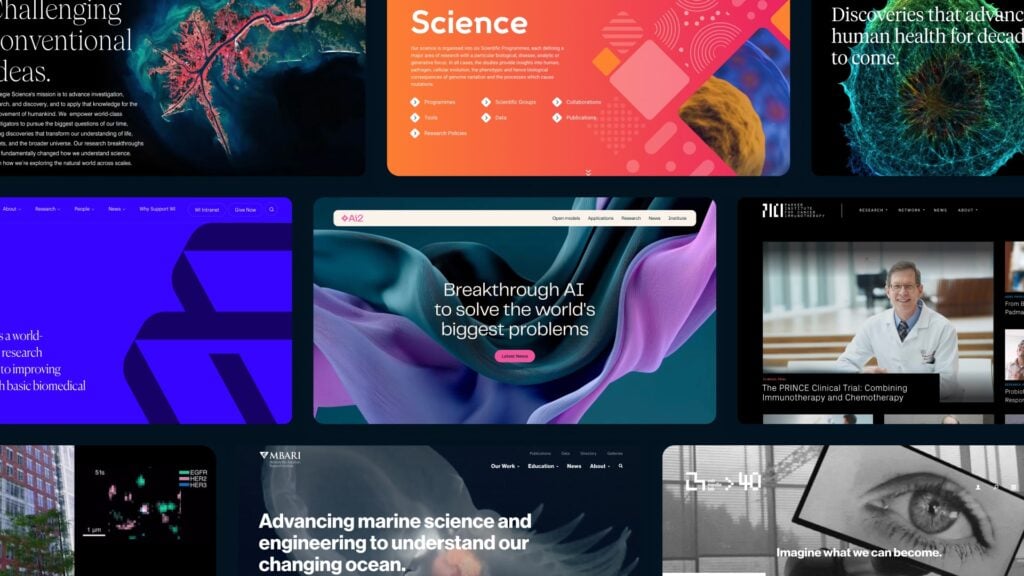
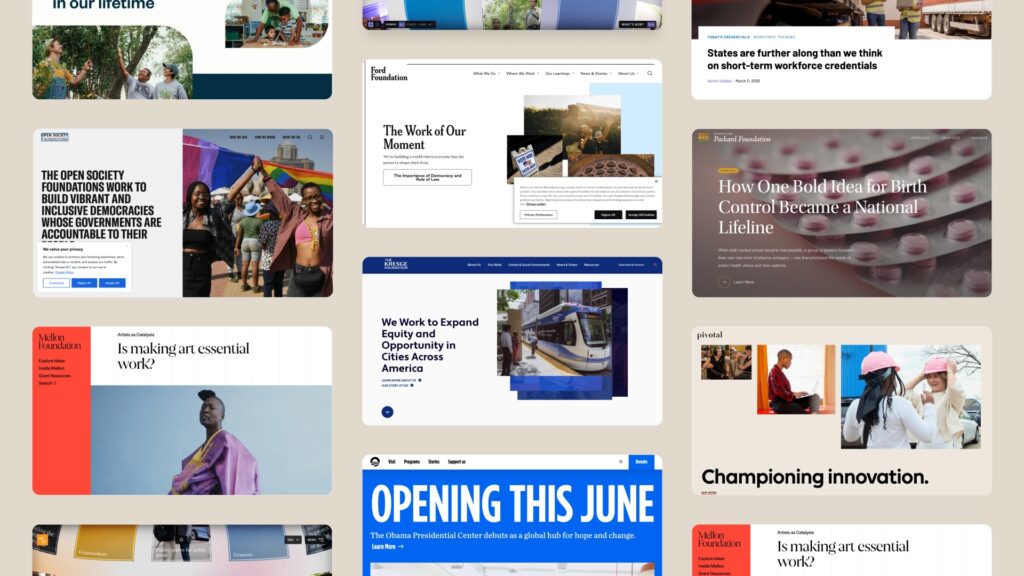
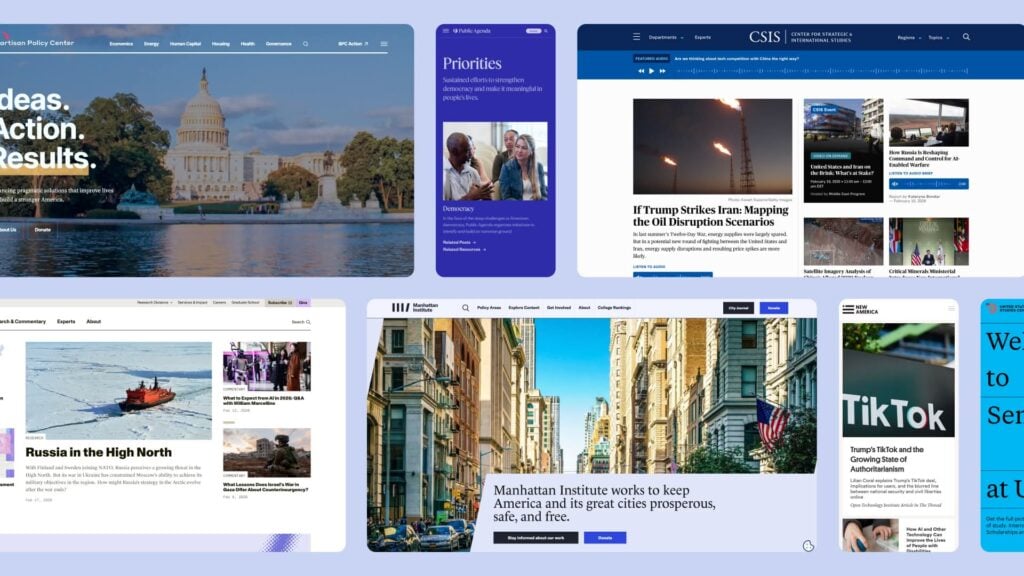
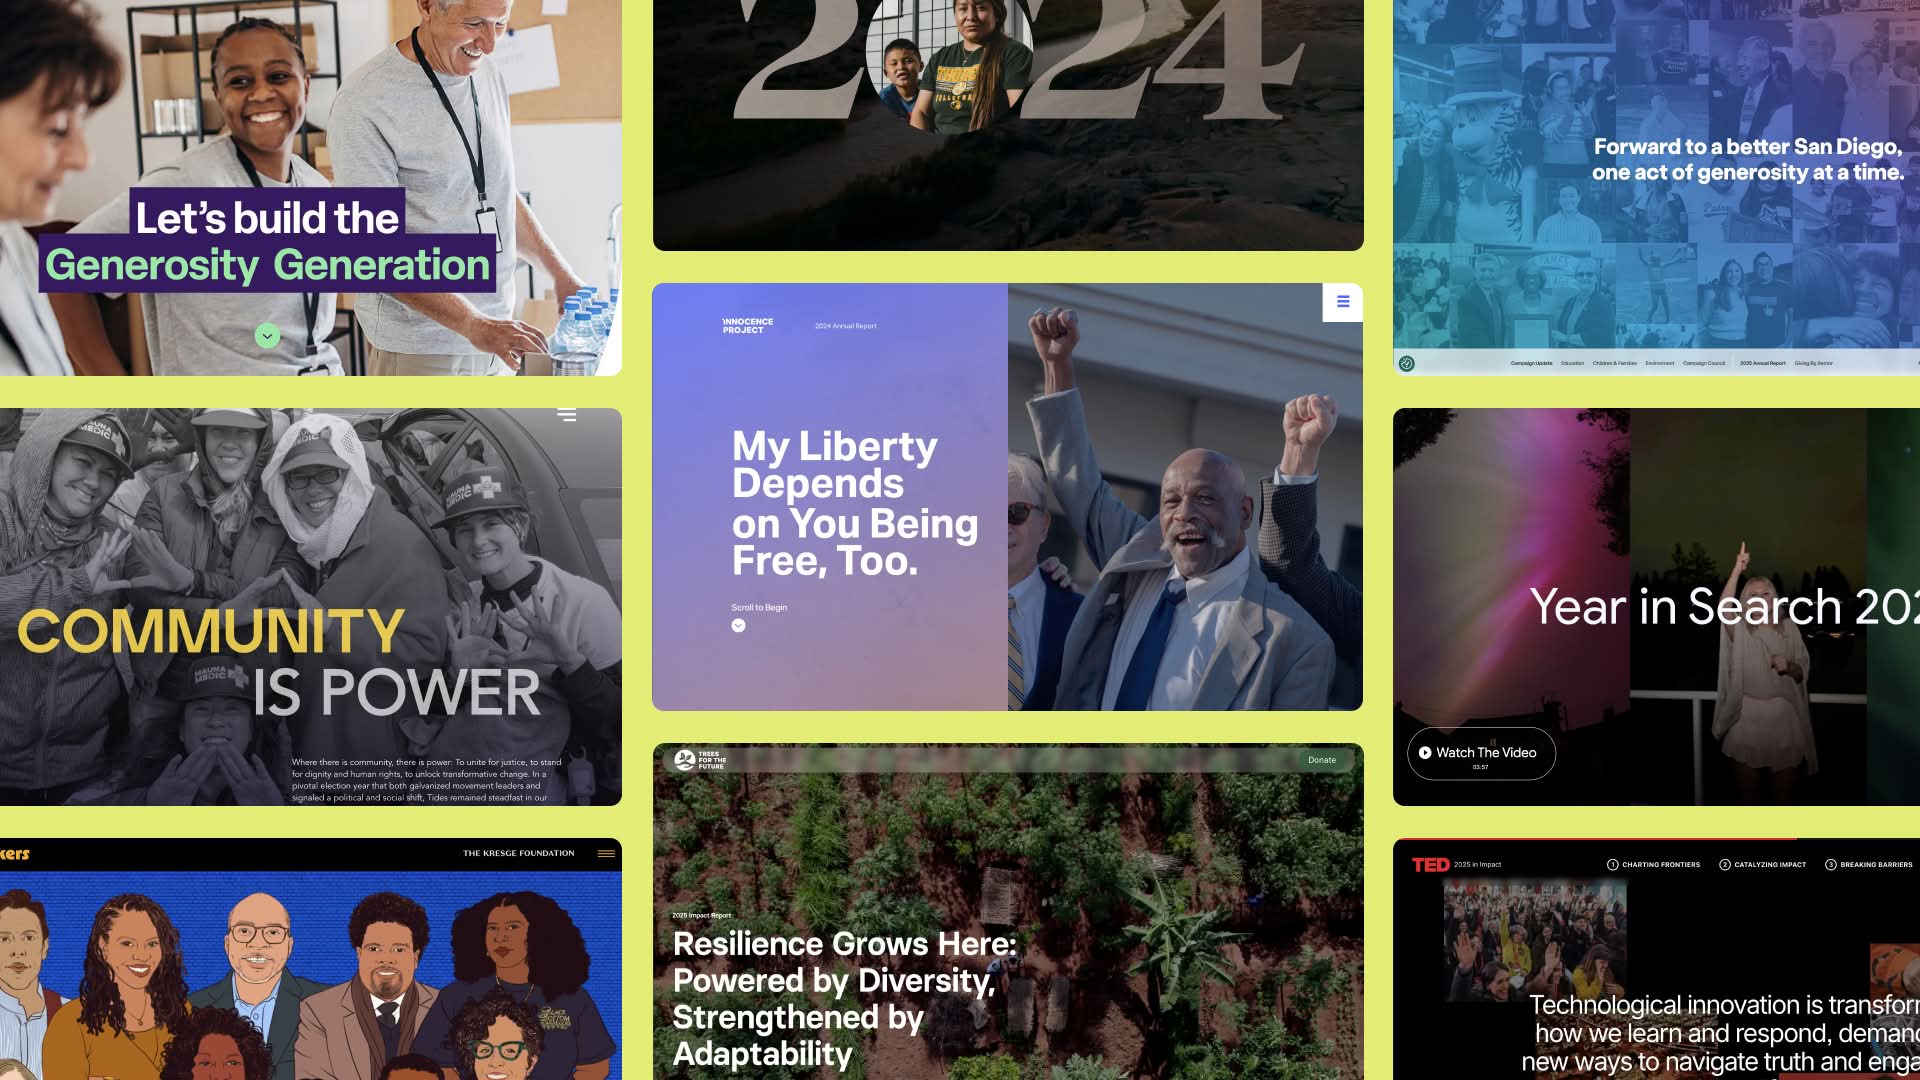
We’ve highlighted 10 digital annual reports that show what’s possible when organizations treat the annual report as a strategic communication platform rather than just a box to check each new year.
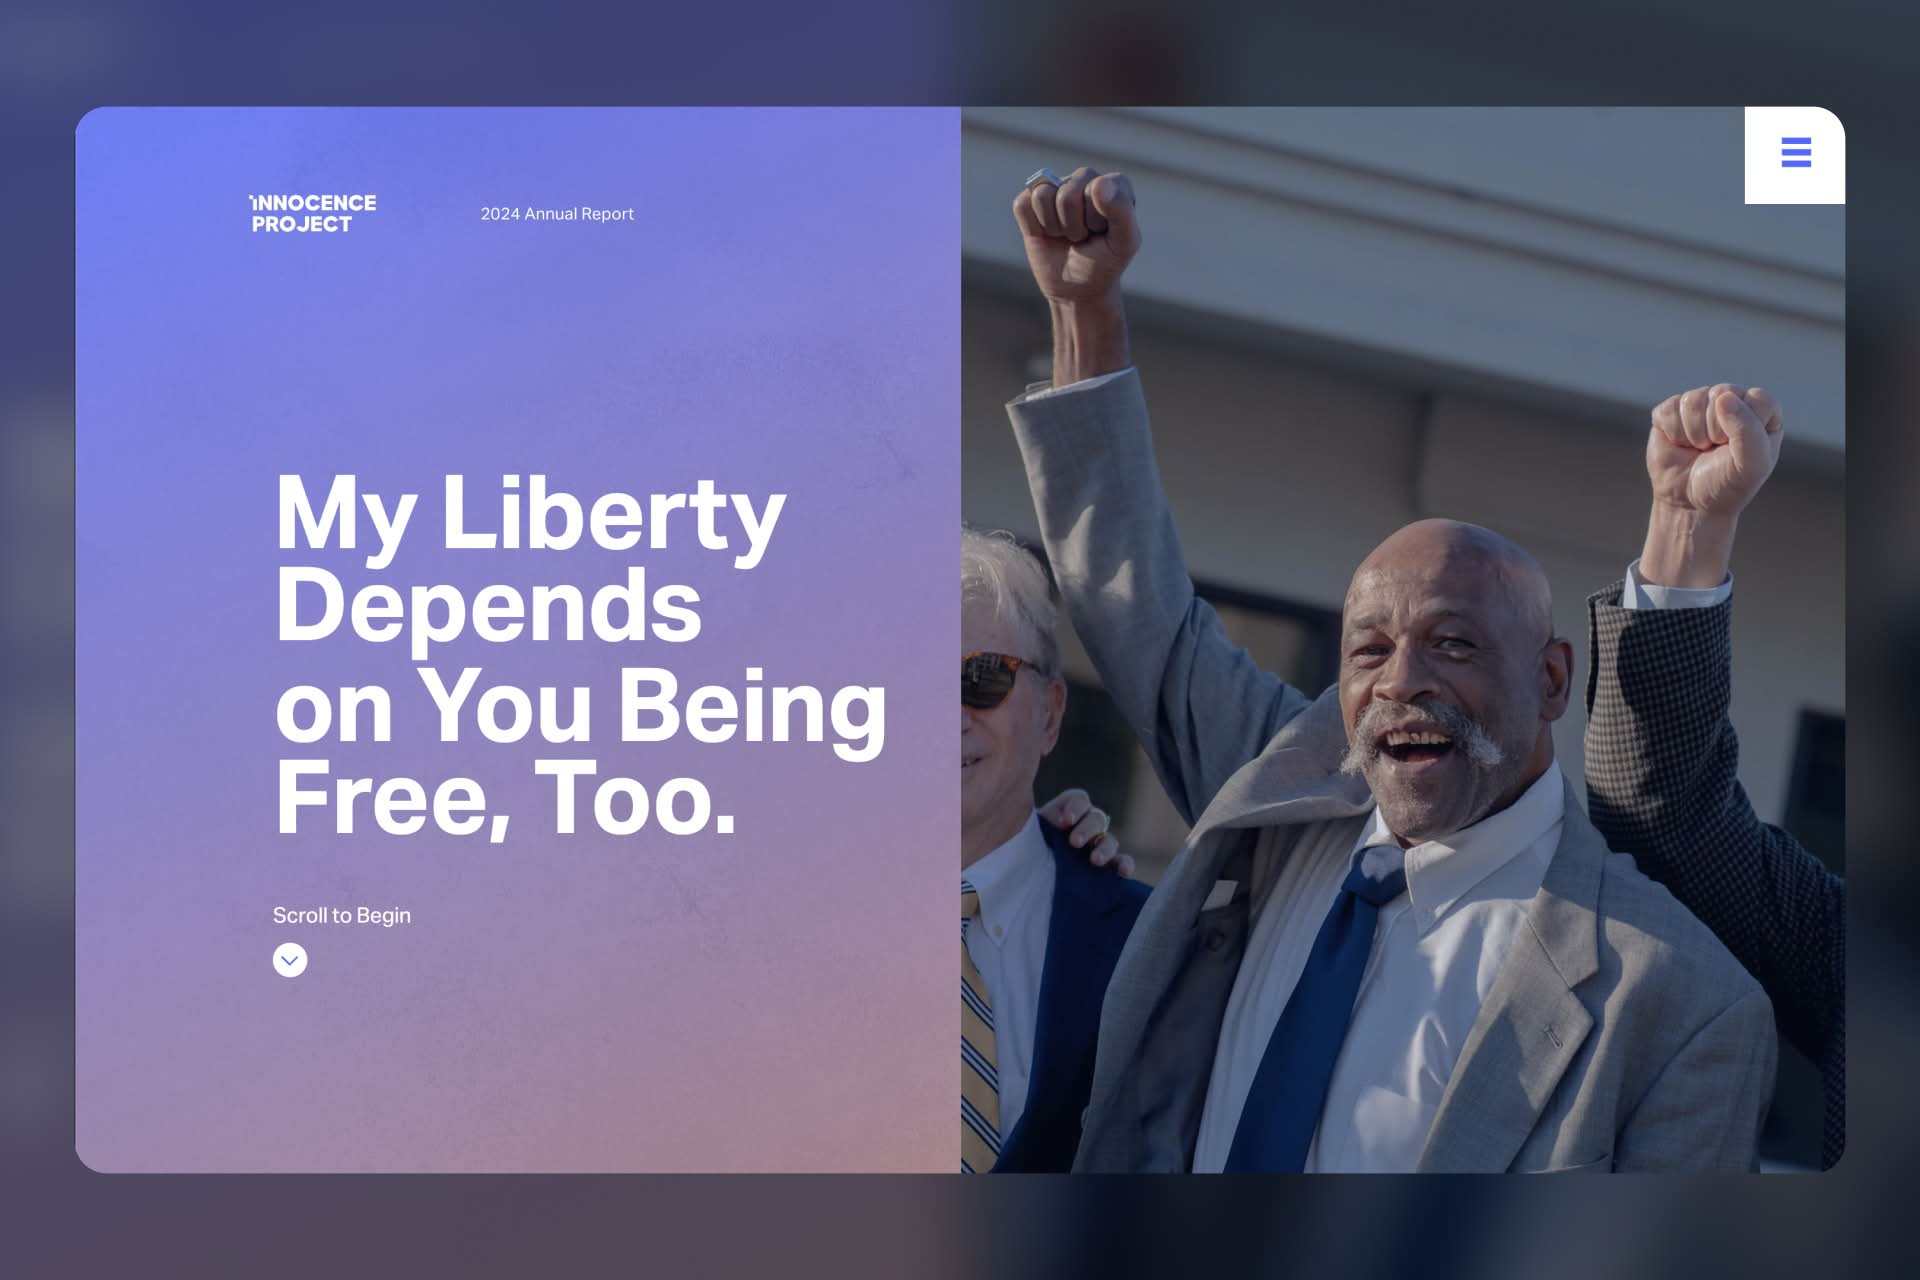
Innocence Project Annual Report
The Innocence Project’s annual report centers people first, using exoneree voices to anchor its broader impact. Video, photography, and first-person storytelling give weight to both individual cases and systemic reform. The report doesn’t shy away from hard truths, which adds credibility rather than diluting the message. Policy wins and personal stories work together to show impact at multiple levels.
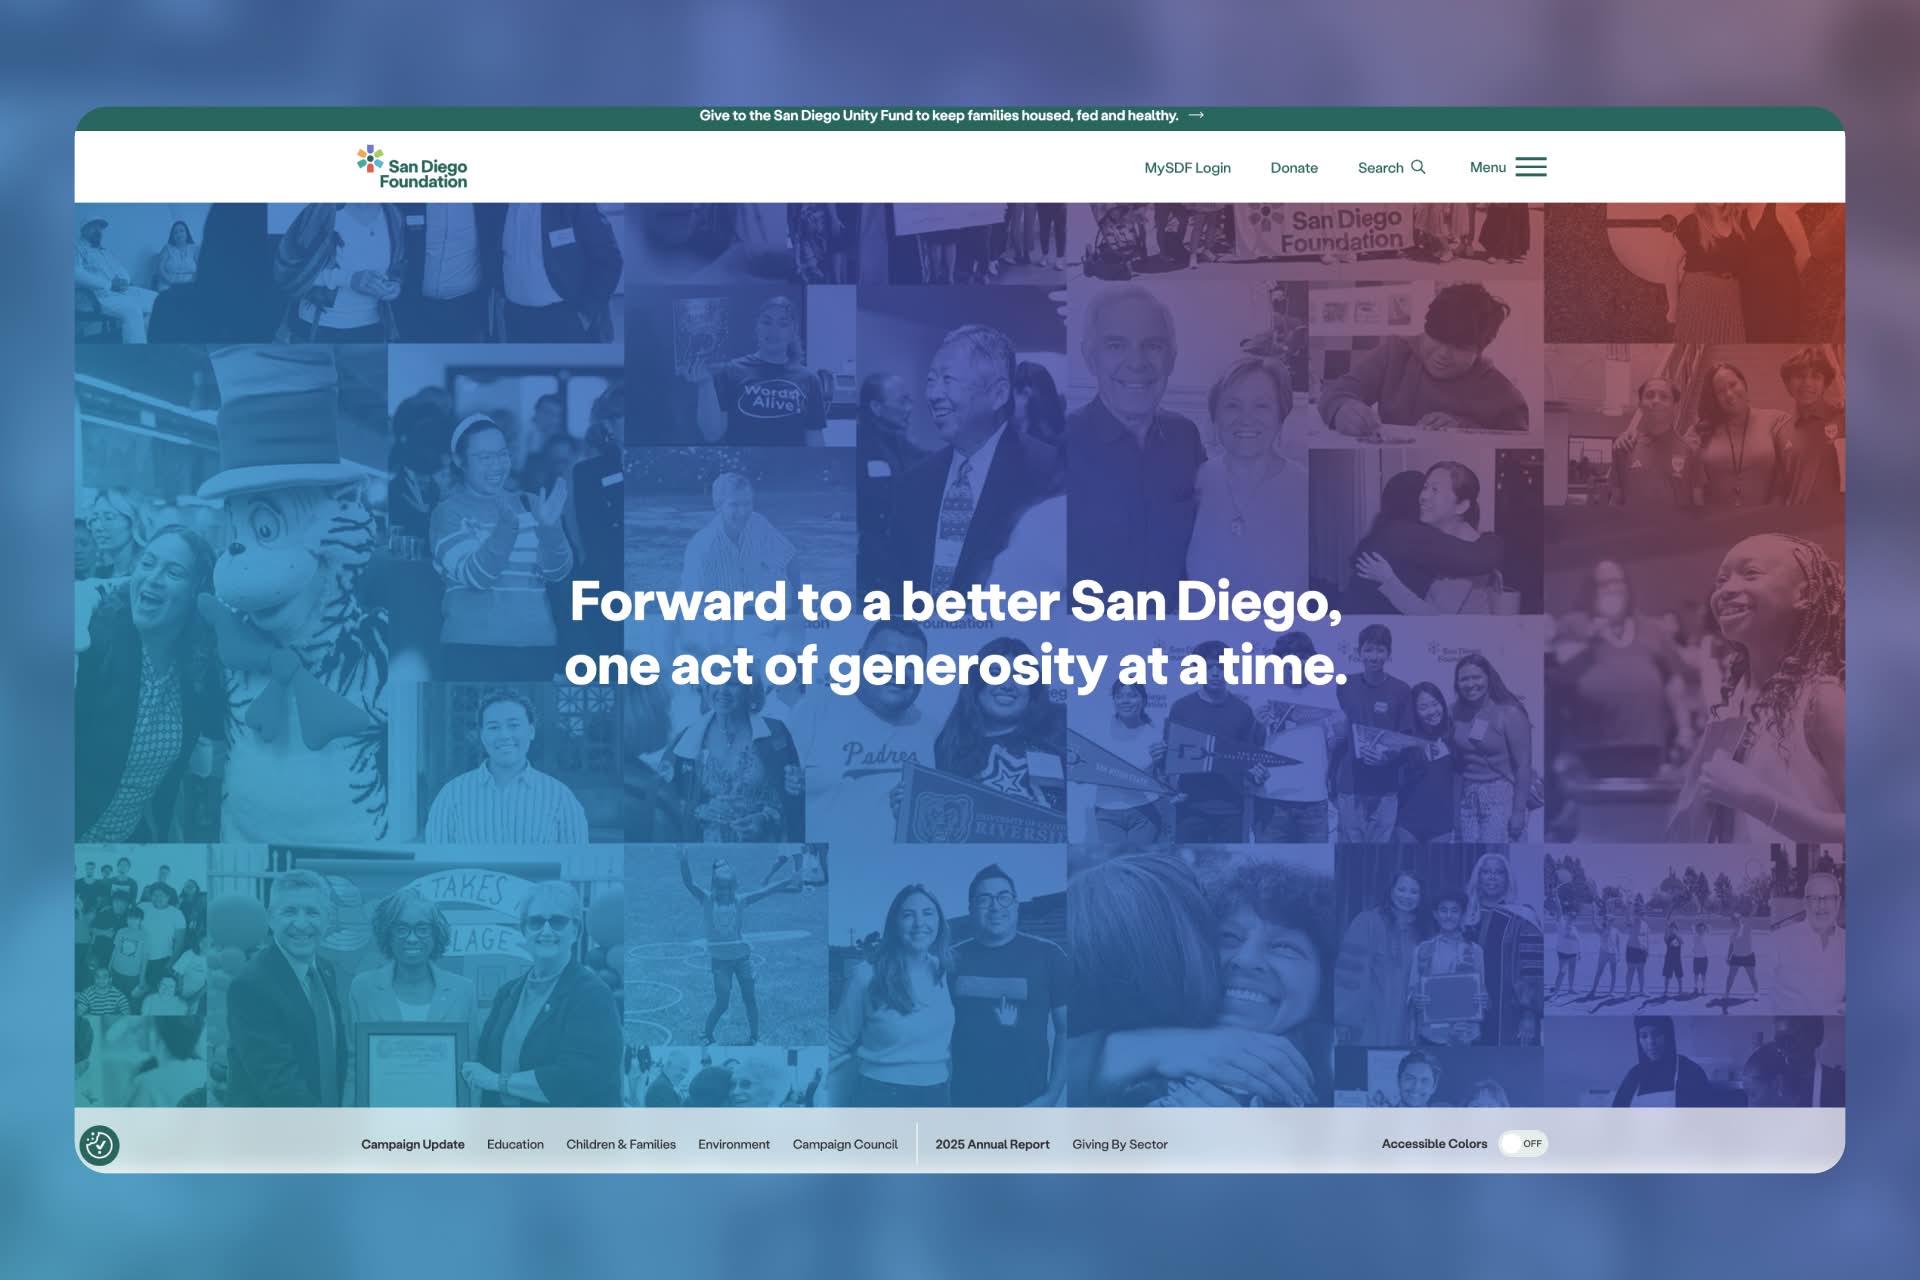
San Diego Foundation Annual Report
San Diego Foundation’s report doubles as a campaign narrative, framing annual impact within its “Fifty & Forward” initiative. Content is organized around clear focus areas, tying community need to donor support and measurable outcomes. The design is polished but restrained, letting data and storytelling work together. Financial progress is integrated naturally, reinforcing both accountability and momentum.
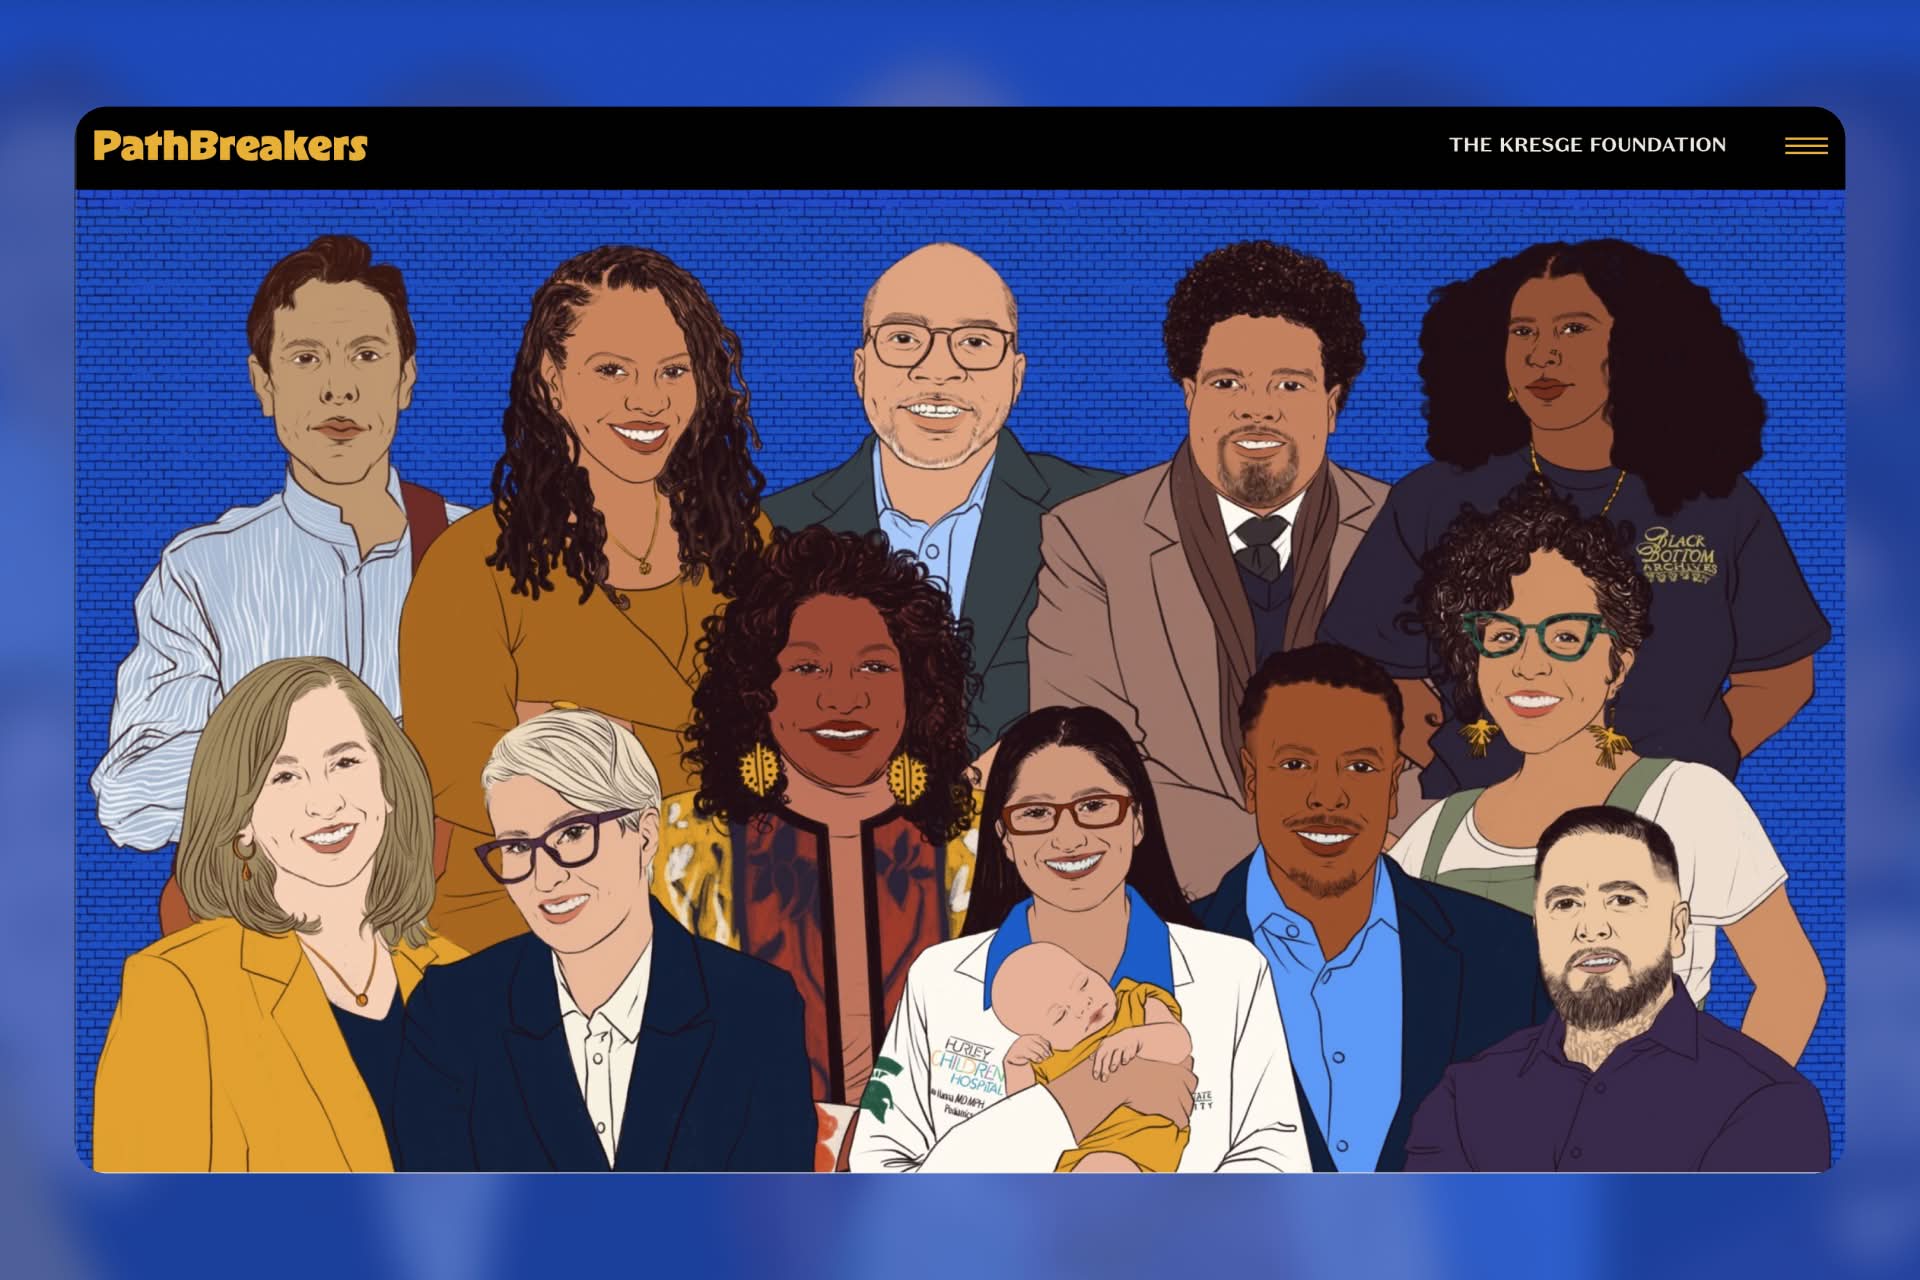
Kresge Annual Report
Kresge’s Pathbreakers report flips the traditional annual report model by centering leaders instead of the institution. Profiles combine photography, written stories, and podcasts to offer multiple entry points. The foundation’s impact is implied through the people it supports rather than spelled out through programs. The result feels more like a storytelling platform than a report.
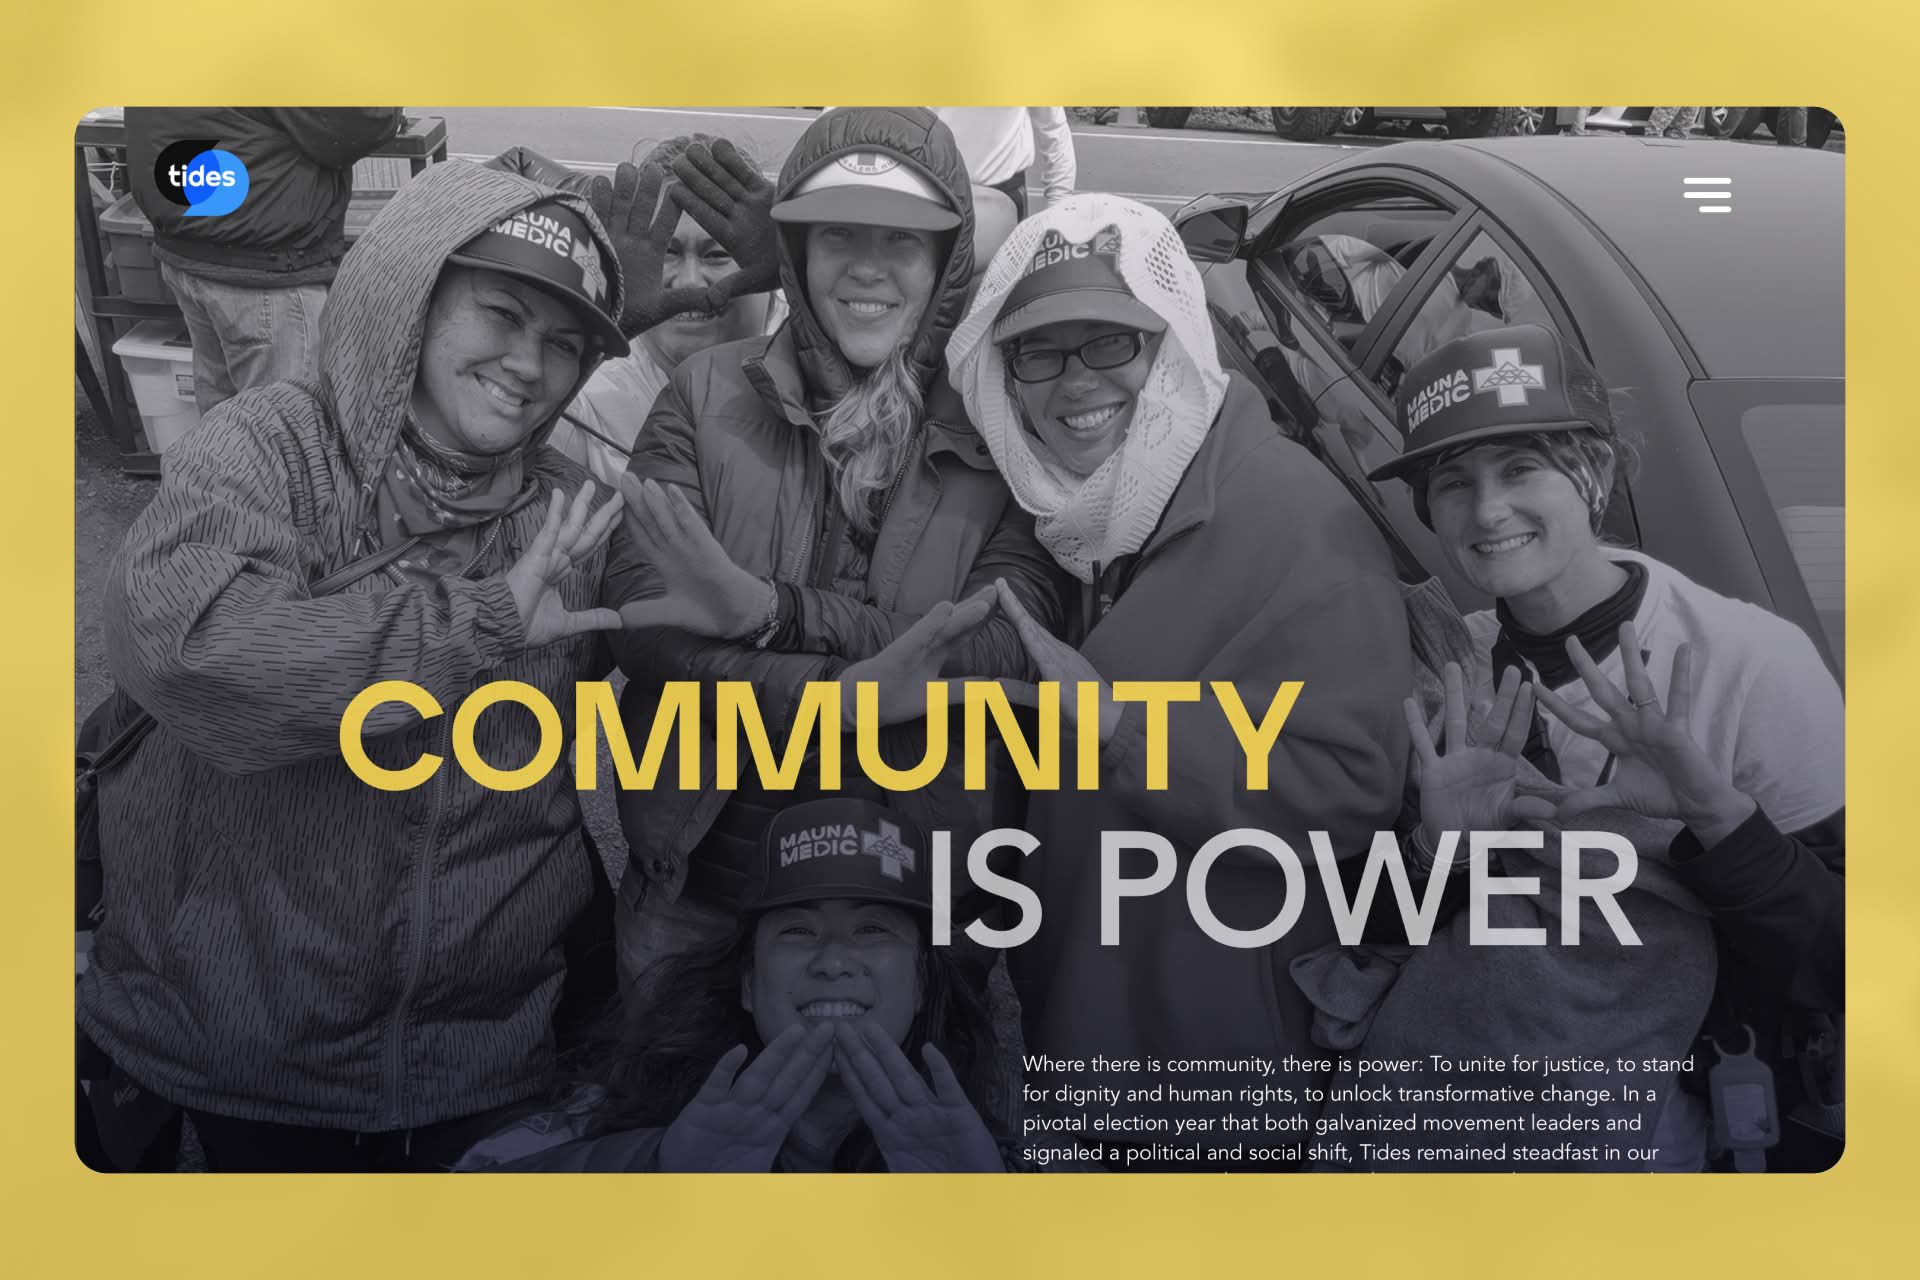
Tides Impact Report
Tides’ impact report focuses less on programs and more on its role as philanthropic infrastructure. The site explains how behind-the-scenes support—fiscal sponsorship, grantmaking, and donor services—enables broader movement work. This framing sets Tides apart from traditional foundation storytelling. The result is values-driven and distinct, with clarity about how impact actually happens.
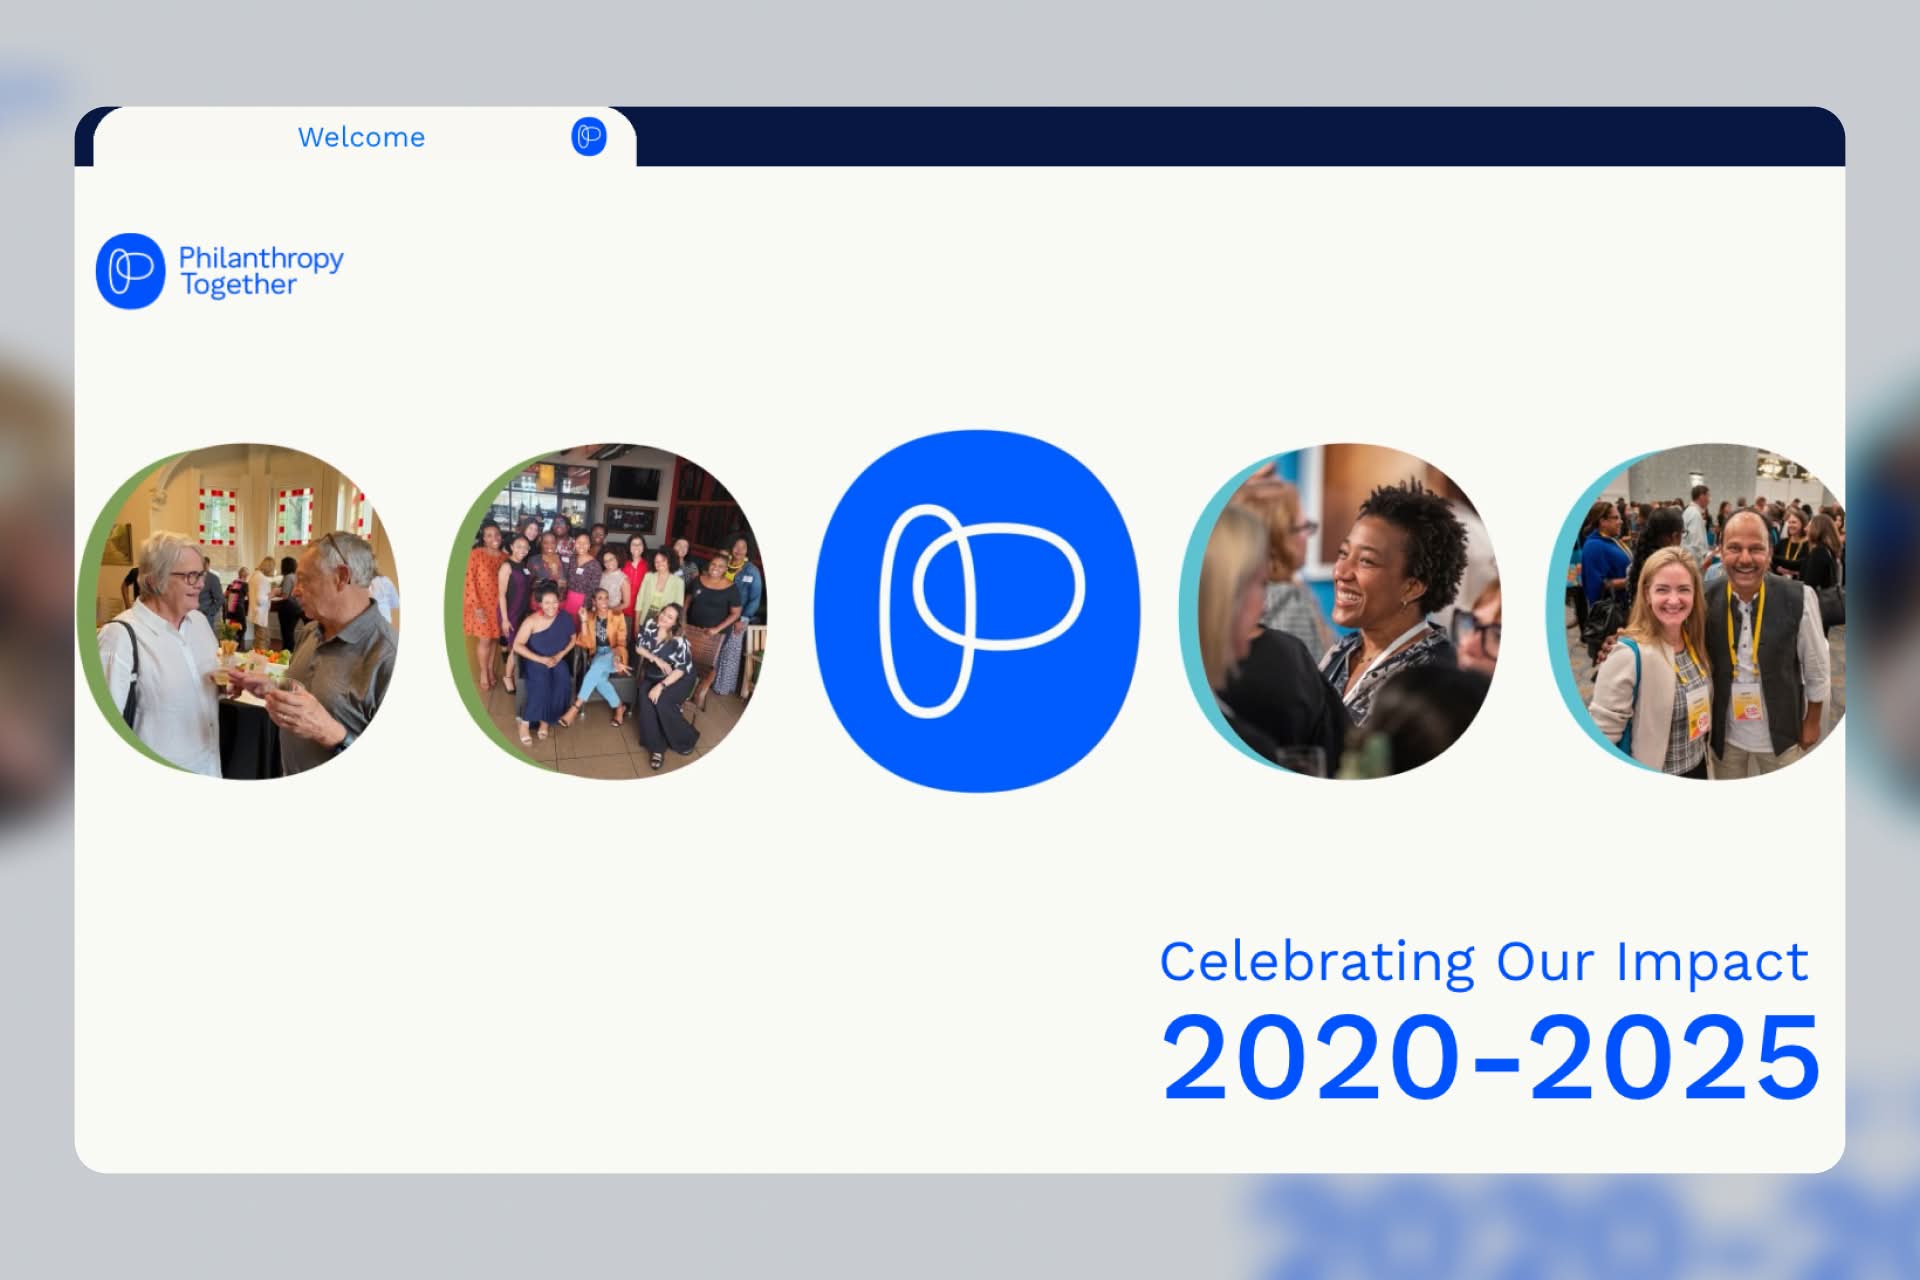
Philanthropy Together Impact Report
Created for its fifth anniversary, Philanthropy Together’s report reflects the collaborative nature of giving circles. Success is measured through participation, growth, and field-building rather than direct service metrics. Visuals emphasize people and networks, reinforcing the organization’s role as a connector. The anniversary framing creates a natural bridge between reflection and future direction.
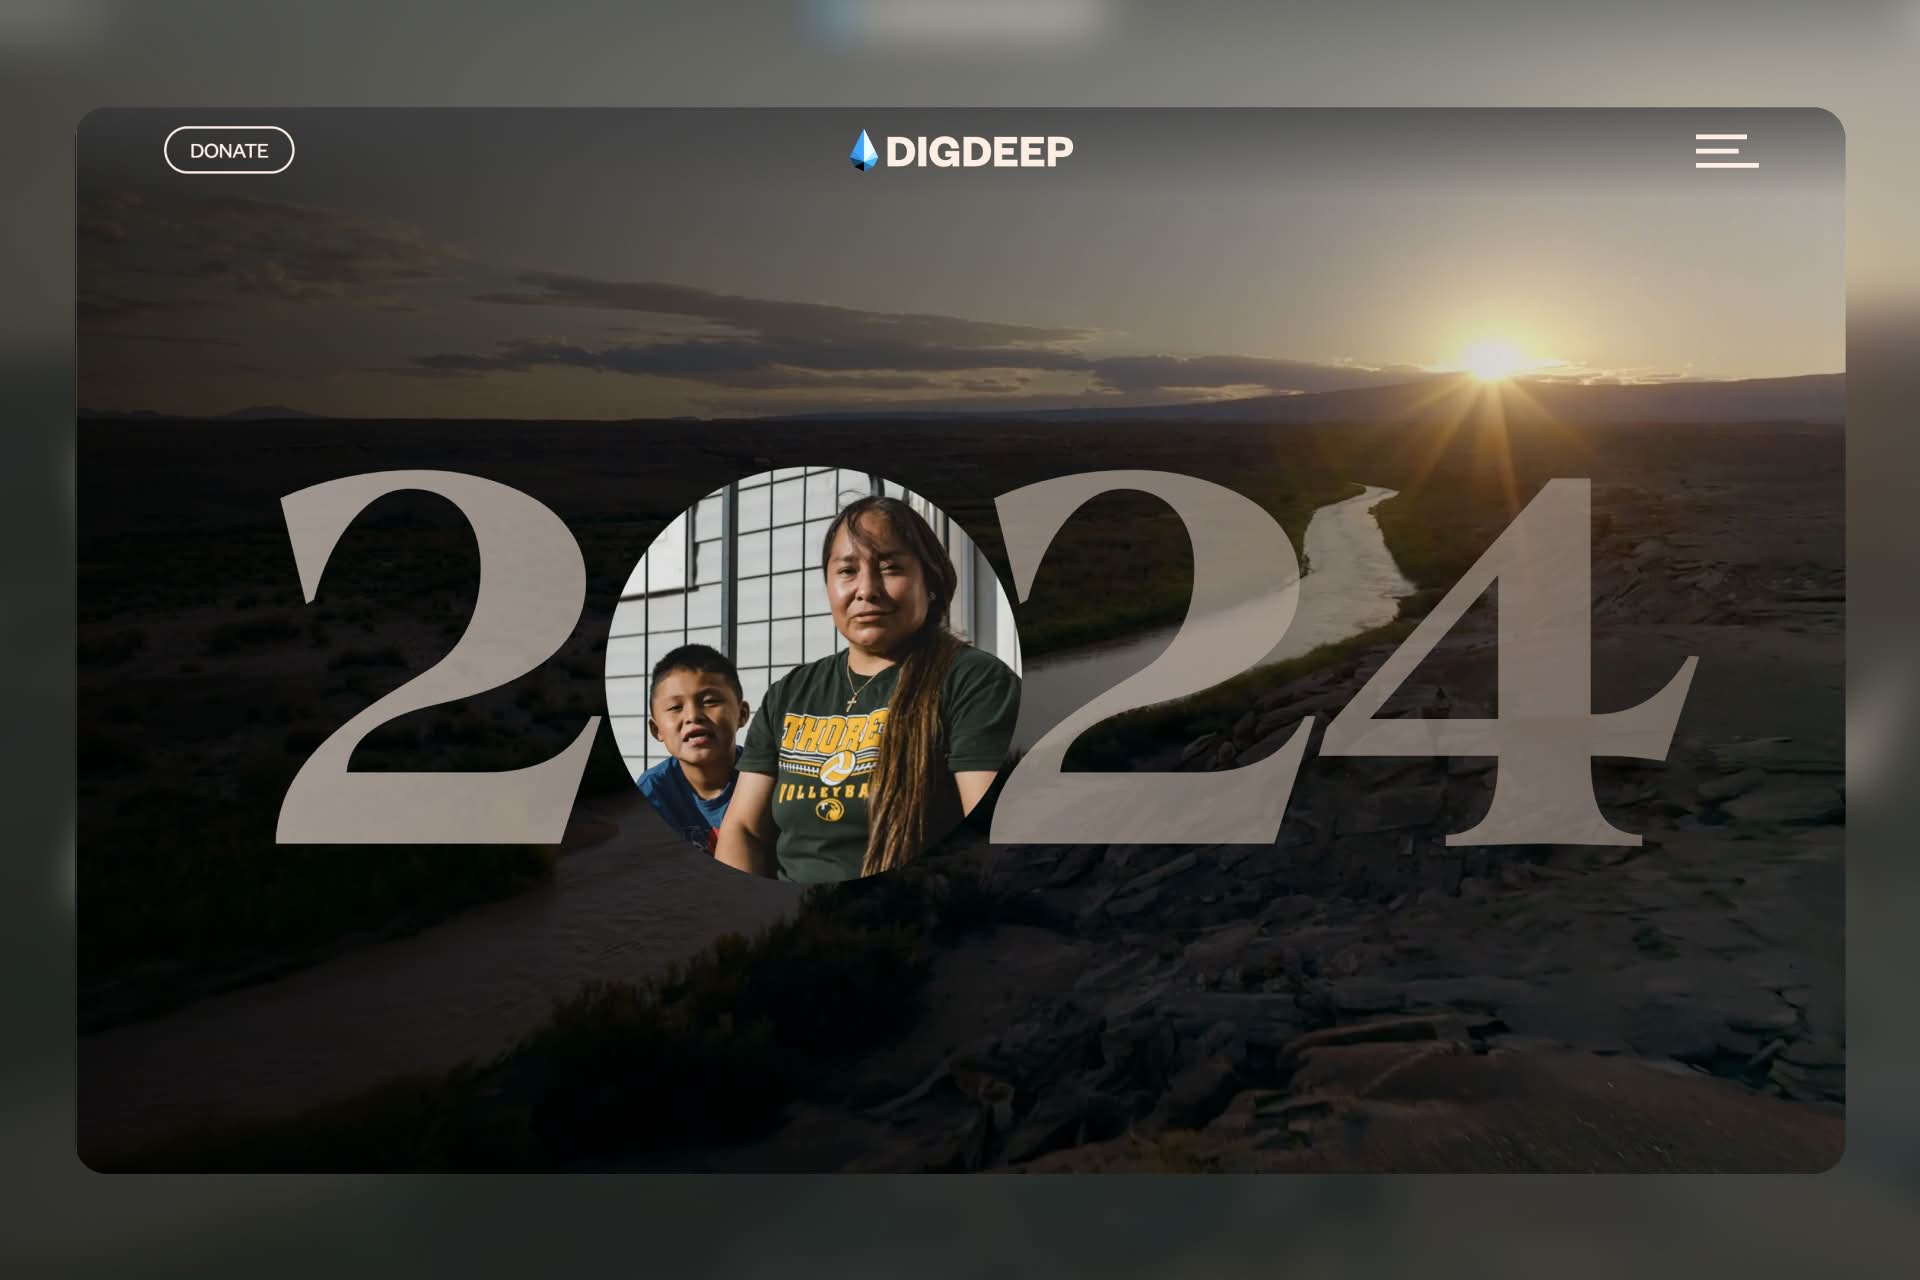
DigDeep Annual Report
DigDeep’s report opens with a clear, memorable focus: access to running water and sanitation in the U.S. The site is structured around four pillars, framing water access as a systems challenge rather than charity. Strong visuals and concise chapters keep the experience grounded and readable. The result is a report that educates while expanding the organization’s audience.
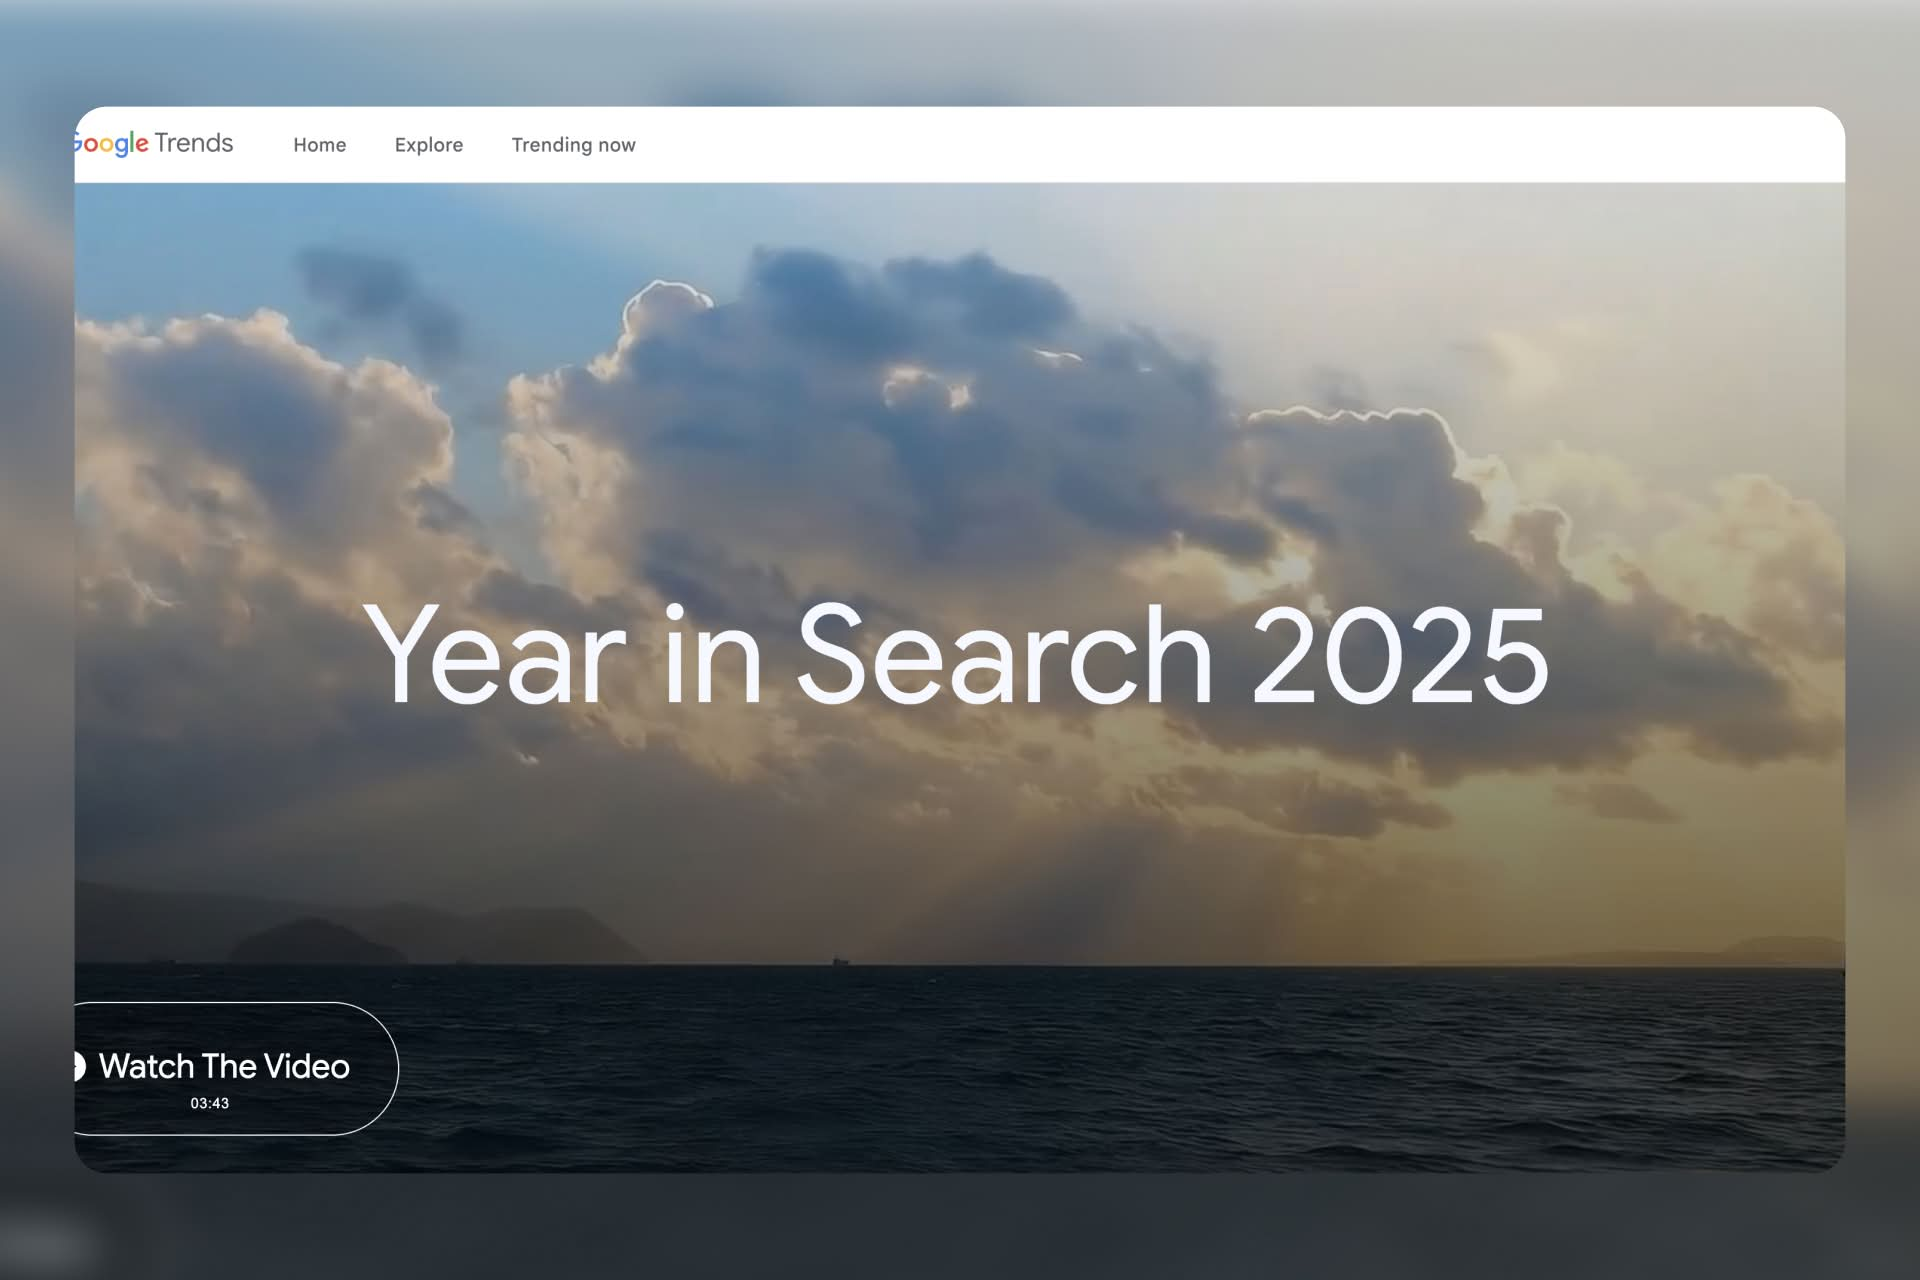
Google Year-in-Search
Google’s Year in Search turns data into cultural storytelling. Rather than presenting statistics in isolation, it organizes trends into themes that feel human and timely. Animation, video, and clean design invite exploration without overwhelming the reader. Built-in sharing tools help the report travel far beyond the site itself.
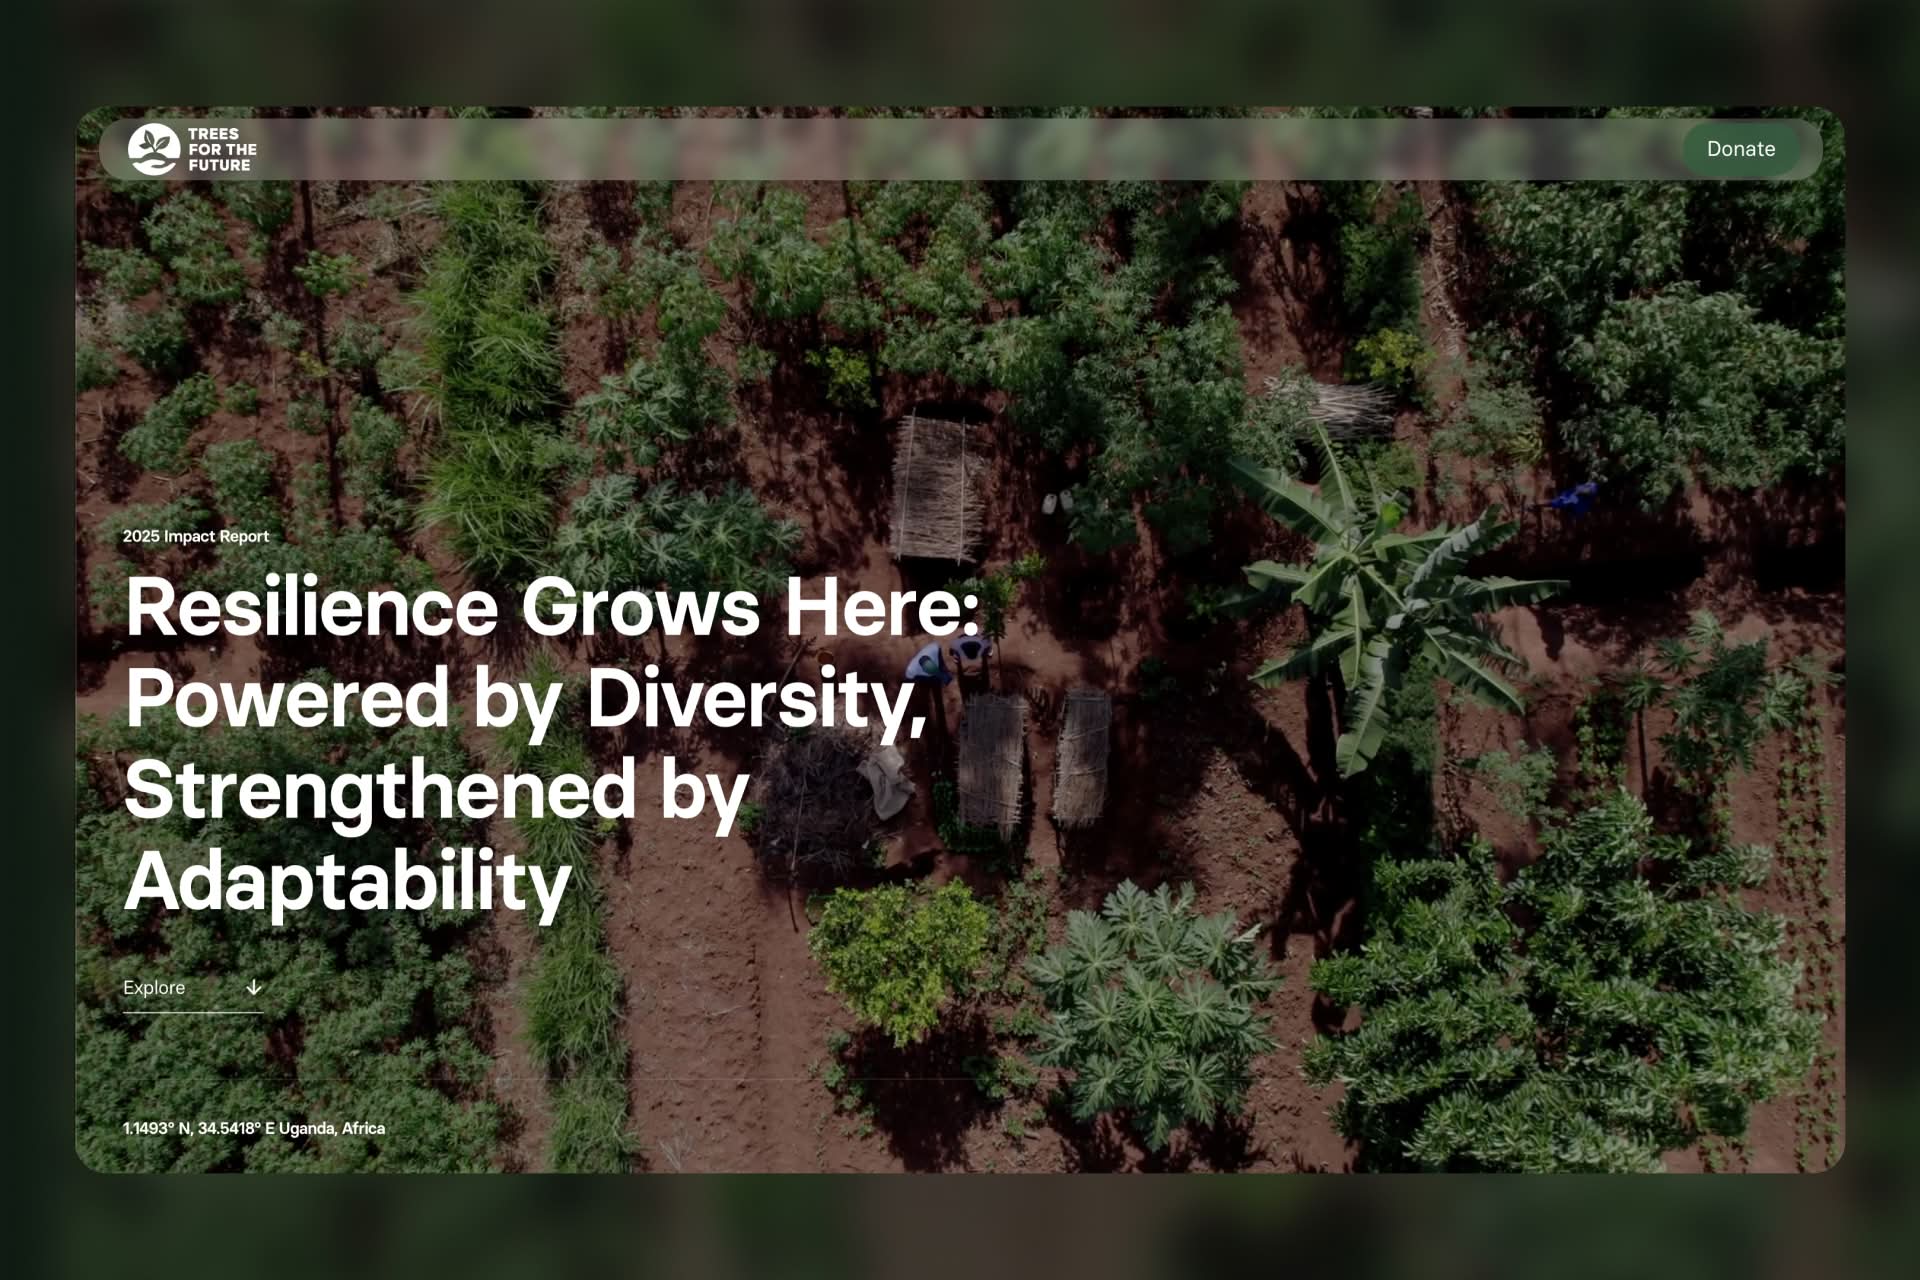
Trees for the Future Annual Report
Trees for the Future uses a calm, scroll-driven experience to mirror the long-term nature of its work. Large imagery, animated stats, and geographic context help ground global impact in specific places. Farmer stories and before-and-after visuals make regeneration tangible. Financials are clear but secondary, supporting the narrative rather than competing with it.
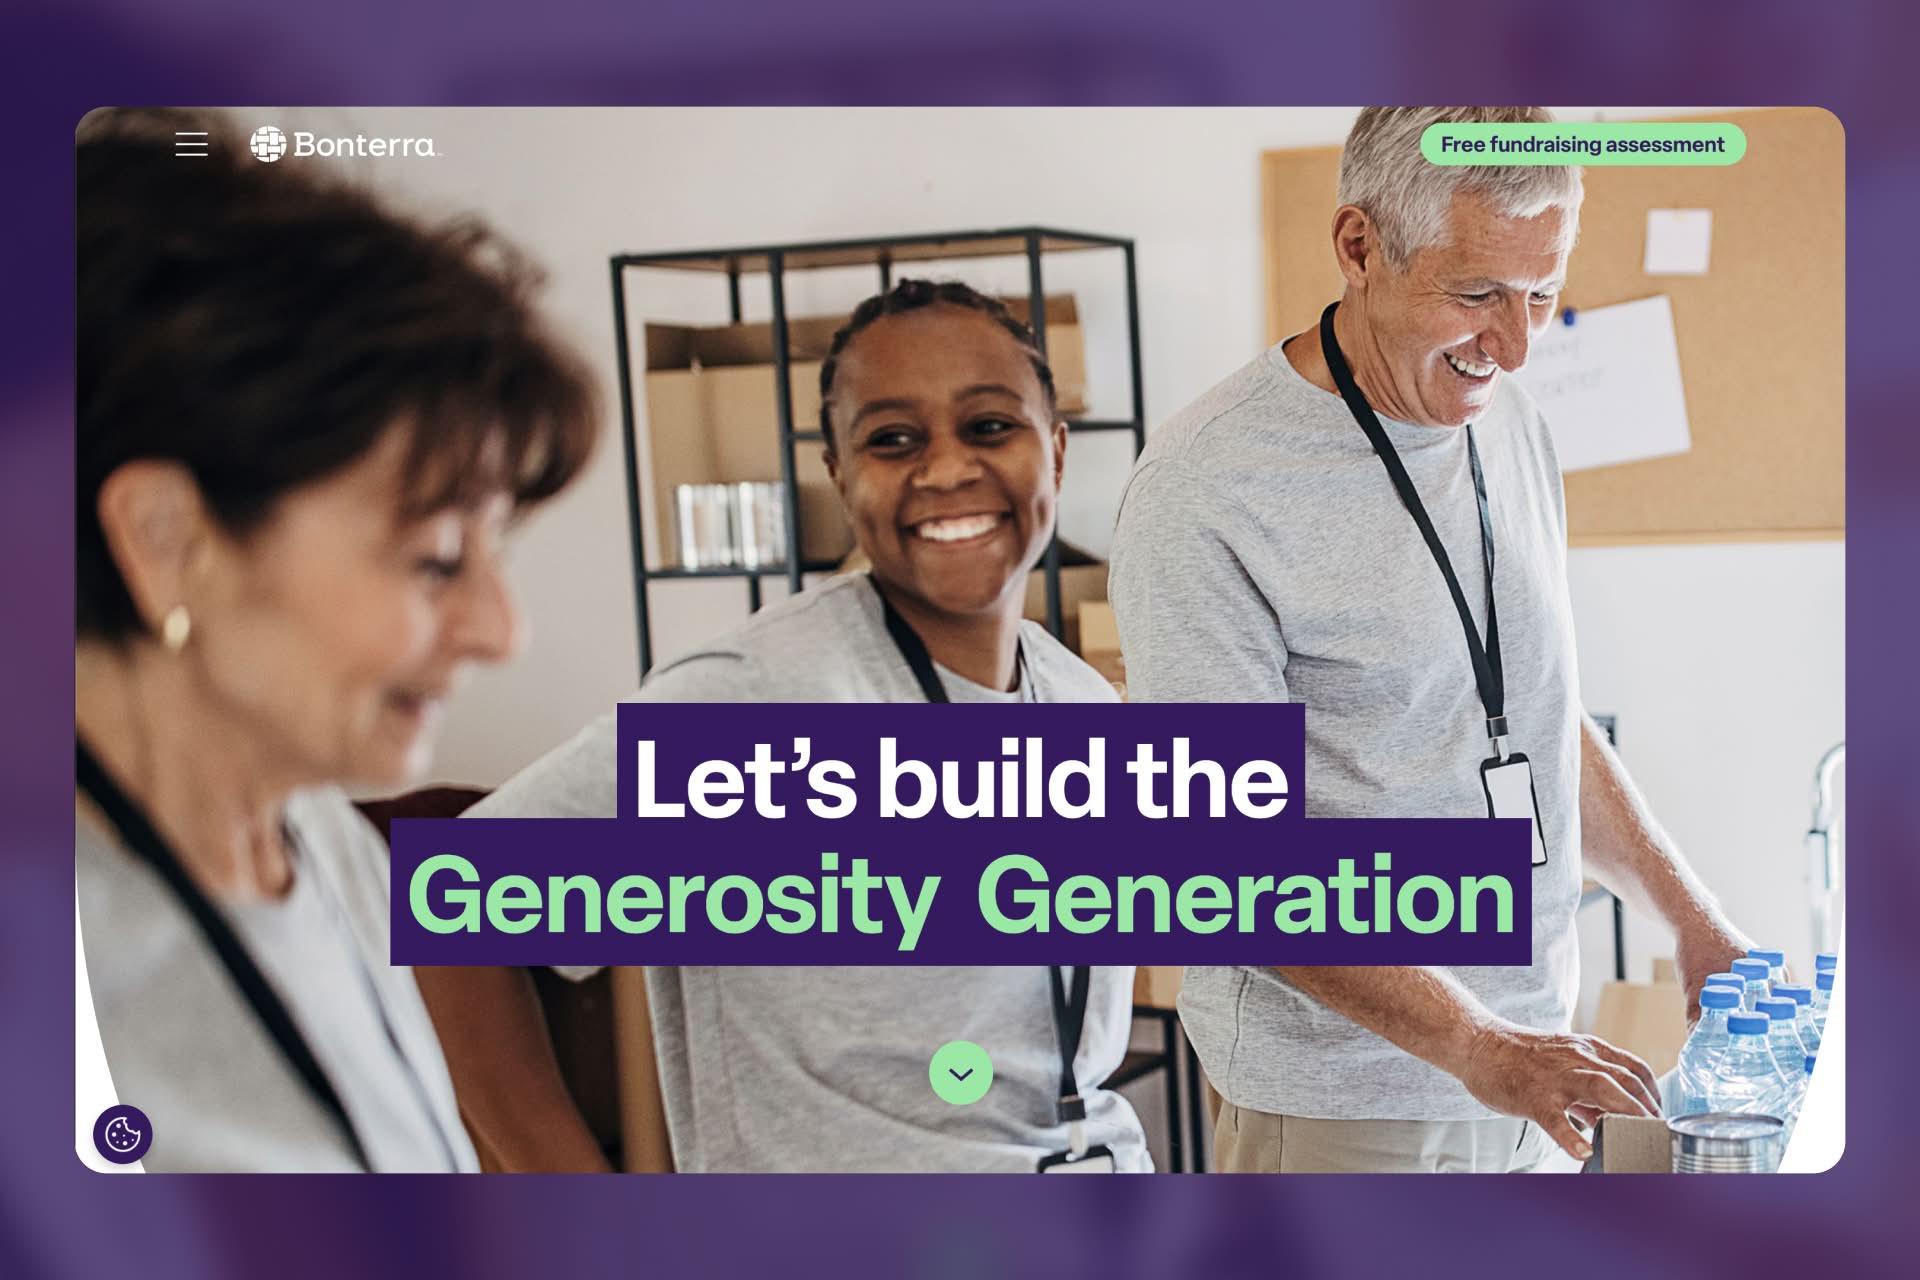
Bonterra Impact Report
Bonterra’s report balances storytelling with utility. Customer examples illustrate how its tools support nonprofit effectiveness, following a clear challenge-to-outcome structure. An interactive fundraising assessment invites readers to engage directly with the content. That shift—from reading to doing—makes the report feel immediately relevant.
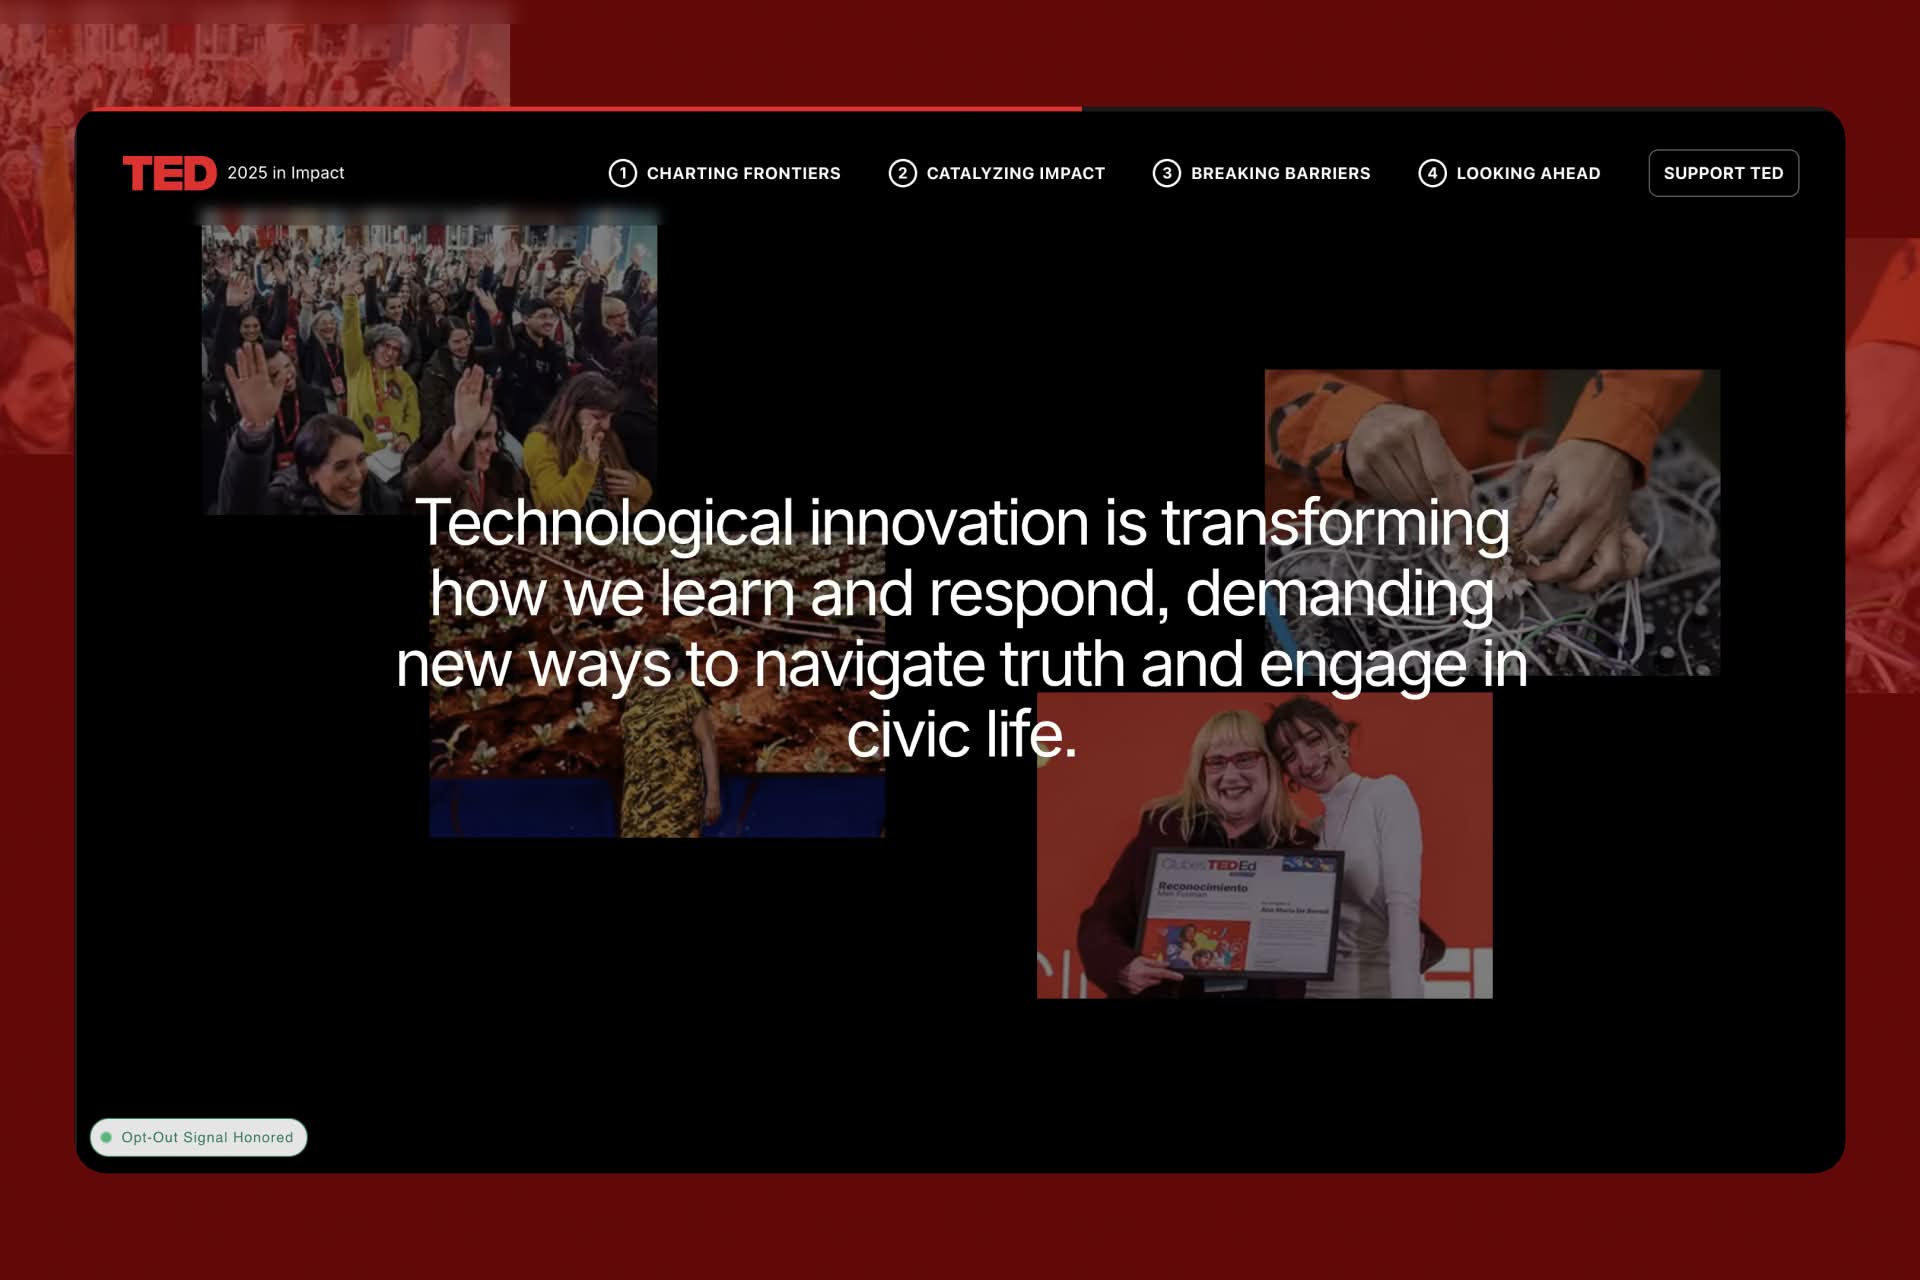
TED Impact Report
TED’s impact report feels curated rather than comprehensive. Short text, strong visuals, and video moments echo the TED Talks experience. Metrics are used as headlines to reinforce scale and reach without dominating the story. The report reinforces TED’s role as a platform for ideas, not just an event organizer.
In Conclusion
For organizations looking to move beyond static PDF, web-based annual reports open new storytelling possibilities and greater reach. Curious what it takes? Contact us.